LEARNING THROUGH LAUGHTER: THE ROLE OF MEMES IN APPLIED ECONOMICS SUBJECTS
APRENDER A TRAVÉS DE LA RISA: EL PAPEL DE LOS MEMES EN LAS ASIGNATURAS DE ECONOMÍA APLICADA
Claudia García-García (Universidad Complutense de Madrid, Madrid, España)1
Sara Fernández (Universidad Complutense de Madrid, Madrid, España)2
Celia Torrecillas Bautista (Universidad Complutense de Madrid, Madrid, España)*3
Abstract
The transmission of knowledge through images has gained importance in recent years with the rise of social networks. Recently, images and memes have begun to be incorporated into teaching, allowing traditional classes to be reinforced through modern and fun activities. This paper adds evidence on this novel educational method, describing an assessment activity using memes in Applied Economics subjects, specifically in International Economics for Business and Spanish Economy, in different degree programs at the Complutense University of Madrid. The activity was analysed through two questionnaires that students completed, reflecting their perceptions both before and after its implementation. Based on their answers, the memes produced, and the grades obtained, various findings are found. The results show that the activity was innovative and aroused students' interest in the subject. It represented an accessible and entertaining way of learning, which generated satisfaction among the students. Moreover, their commitment and effort were reflected in the quality of the memes produced.
Keywords: memes, applied economics, assessment, perception, higher education.
JEL Codes: A10, A22
Resumen
La transmisión de conocimientos a través de imágenes ha cobrado importancia en los últimos años con el auge de las redes sociales. Recientemente, las imágenes y los memes han comenzado a incorporarse a la enseñanza, lo que permite reforzar las clases tradicionales mediante actividades modernas y divertidas. Este artículo aporta datos sobre este novedoso método educativo, describiendo una actividad de evaluación que utiliza memes en asignaturas de Economía Aplicada, concretamente en Entorno Económico Internacional y Economía Española, en diferentes programas de grado de la Universidad Complutense de Madrid. La actividad se analizó mediante dos cuestionarios que completaron los estudiantes, reflejando sus percepciones tanto antes como después de su implementación. A partir de sus respuestas, los memes producidos y las calificaciones obtenidas, se han extraído diversas conclusiones. Los resultados muestran que la actividad fue innovadora y despertó el interés de los estudiantes por la asignatura. Supuso una forma accesible y entretenida de aprender, lo que generó satisfacción entre los estudiantes. Además, su compromiso y esfuerzo se reflejaron en la calidad de los memes producidos.
Palabras clave: memes, economía aplicada, evaluación, percepción, educación superior.
Clasificación JEL: A10, A22
1. INTRODUCTION
In universities, professors should be able to transmit existing theories effectively (Guadarrama Herrera et al., 2020). To achieve this goal, it is important that university teaching adapts and uses new tools that engage students and motivate them in the learning process. Traditional teaching methods should be more adaptable to meet the changing demands of today's society, which implies that professors should innovate and find new ways to communicate with students, while students should be open to new ways of learning (Salinas, 2004; Rodríguez Guevara, 2021). In this sense, information and communication technologies and the digitalization they have generated offer new learning opportunities (Kozma, 2003).
In this context of digital tools, the phenomenon of memes emerged in recent decades. The word “meme” was first coined by Richard Dawkins in 1976 in his book ‘The Selfish Gene’ (Dawkins, 1989; Solon, 2013). Nowadays, after the evolution of the concept within the new ICTs, a meme is defined as an image, video, and piece of text or similar, usually with a sense of humour, that is copied, sometimes modified, and spread rapidly by different users (Lonnberg et al., 2020). With these characteristics, the meme has developed great potential for the educational field (Guadarrama Herrera et al., 2020; Suárez-Guerrero et al., 2022), as it is a very current and widely used tool in everyday life by students.
Despite the potential of memes in education, as far as we know, no research mentions applications of memes in the field of applied economics education. However, we find some uses in other disciplines such as the studies of Guadarrama Herrera et al. (2020) for Analytic Geometry, Ligarretto (2020) for Cyberculture and Citizenship, Pinto (2019) for Contemporary Approaches to Communication II, and Suárez-Guerrero et al. (2022) for Teaching and Learning in the Digital Society. These applications conclude that the use of this tool allows the transformation of the conventional teaching method in a wide range of subjects, allowing for an improved link with students, with digital networks, and with the educational process. In addition, the authors also point out that they promote creativity and the critical and reflective aspect on the part of the students, as well as the students' capacity for synthesis, among other aspects.
Given the possibilities that this tool presents for education and the scarce use that is still being made of it, this paper analyses the use of memes in the teaching of Applied Economics subjects. Specifically, the activity has been developed within the subject of International Economics for Business of the Double Bachelor’s Degree in Law-Business Administration (hereinafter: double degree in Business Administration), as well as in the subject of Spanish Economy of the Double Bachelor’s Degree in Economics-International Relations, the Double Bachelor’s Degree in Management and Public Administration-Economics (hereinafter: double degrees in Economics) and the Bachelor’s Degree in Economics of the Complutense University of Madrid (UCM) during the academic year 2024/2025.
The activity required pairs of students to create memes on various course topics, after which the class voted to identify the best examples, which were subsequently presented. To assess students’ perceptions, two questionnaires were completed before and after the activity. The results show that the students rated this innovative activity positively, reflecting the students' effort and favourable perception. The students recognised that it facilitated their understanding of the subject and offered an alternative mode of learning.
The paper is organized as follows. In the next section, we present the literature review. The third section describes the materials and methods. In section number four, we show the results. The final section draws the main conclusions from the analysis.
2. LITERATURE REVIEW
The digital tools in the higher education system have made the teaching process dynamic and student-centred, resulting in a change in education. Authors such as Rodríguez Guevara (2021) point out that integrating information and communication technologies in university education enhances creativity and encourages student engagement.
In the field of digital education, there has been a growing interest in social networks as innovative tools (Marín-Díaz and Cabero-Almenara, 2019; Smith, 2017). They emerged at the beginning of the 21st century and have become an effective tool for communication (Guadarrama Herrera et al., 2020; De Haro, 2010). Recent studies such as those of Awidi et al. (2019) and Brenley and Covey (2018) indicate that these digital platforms promote interaction among students and enhance learning processes that yield favourable results. It is in the context of social networks where the meme emerges as an innovative option for teaching that can be used in different areas of study such as applied economics. When incorporated into these digital environments, memes not only encourage learning but also promote a participatory and stimulating atmosphere (Dynel, 2022).
The word “meme” was defined as a cultural feature that is acquired by social learning and transmitted from person to person, based on the idea of how genes transmit biological information (Dawkins, 2006). It is not an acronym, but it is derived from the Greek (μίμημα /mímēma/), meaning “something being imitated”, adapting it to sound similar to “gene” (Dawkins, 1989). With the advent of the digital age, the concept of meme evolved. Suárez-Guerrero et al. (2022) defined it as cultural units embedded with meaning, considered products of popular digital culture and characterised as humorous, viral, creative, collective, and global, which take the form of an image, or a video accompanied by captions. In particular, Forner Marqués (2021) commented that a meme could be understood as a visualisation of three types of art simultaneously: conceptual, vernacular, and post-internet art (see Figure 1). Conceptual art is an artistic movement that goes beyond the work of art as a physical object and pays more attention to conceptualisation (Urbina, 2005). Vernacular art minds to the everyday and the mundane, to the kind of things that we all experience on an ordinary basis, and it is usually made by self-taught artists (Brown and Maudlin, 2012; Rex and Woywod, 2014). Finally, post-internet art is an artistic trend encompassing creations shaped by the web and its influence on visual styles, cultural dynamics, and societal norms (Wallace, 2014). If we combine the three types of art defined previously, we have the identification of the meme as an artistic expression.
FIGURE 1. THE MEME AS AN ARTISTIC EXPRESSION
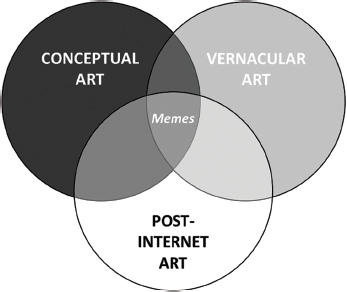
Source: Own elaboration based on the notes in Forner Marqués (2021).
Based on the above and considering that memes are cultural units that emerge in digital environments and spread rapidly (Solon, 2013), the application of memes in education could have numerous advantages, as they combine humorous visual elements with academic content, making it easier to capture students' attention. However, when applying them in teaching, it is important to distinguish between memes in the strict sense and memetic constructs (Dynel, 2022). The former refers to the use of a meme created and popularised on the internet that can be used for evaluative purposes during learning sessions. The latter (memetic construct) refers to the use of memes as a tool to demonstrate student learning, without the obligation for them to go viral and to facilitate, informally and humorously, the understanding of more complex educational concepts (Suárez-Guerrero et al., 2022). Additionally, we can distinguish between reflective, situational or social memes. The first ones are those aimed at providing personal improvement advice and inspirational phrases; situational memes represent a circumstance that is frequently encountered in daily life (Ibáñez, 2019); and, finally, social memes seek to raise awareness of social problems related to more formal aspects such as policy, economy, religion, etc (Castro and López, 2023). All of them, whether directly or indirectly, use humour and irony as a form of entertainment and as a vehicle for the transmission of opinions (Castro and López, 2023; Ibáñez, 2019).
Therefore, the advantages of the use of memes in the classroom are numerous. Several studies point out the ability of this tool to make complex concepts more accessible and attractive (Guadarrama Herrera et al., 2020; Ligarretto, 2020; Pinto, 2019; Dynel, 2022). In addition, they also encourage critical thinking and creativity, facilitate the understanding of concepts through visual synthesis (Guadarrama Herrera et al., 2020; Ligarretto, 2020), and help to establish links between theory and real-life situations to enrich contextualised learning (Pinto, 2019). In this sense, Dynel (2022) in his study on memes and COVID-19 in education shows the usefulness of this tool to promote students' analytical skills.
However, despite all the above-mentioned advantages of the use of memes in university education, their application should also be careful and responsible. In this regard, authors such as Dongqiang et al. (2020) and Tidy et al. (2024) have highlighted that these resources should enhance learning and not distract from it, so they should be integrated into the educational environment with prudence. Furthermore, although memes allow ideas to be expressed quickly, it is essential that their content is clear and appropriate to avoid misunderstandings (Brenley and Covey, 2018).
Considering that one of the main advantages mentioned above is that it helps in the understanding of complex concepts, it seems appropriate to use it in the field of economics learning. In this area of knowledge, many concepts are transmitted to students and some of them could be complex, which often hinders the correct understanding of the subject. For this reason, digital tools such as memes can be very useful. Although to our knowledge there are no studies that report the use of memes in economics subjects, there are reports that mention the use of other digital tools (Navrouzoglou et al., 2024; Fernández et al., 2024; Botts, 2024). For example, Fernández et al. (2024) have applied the use of podcasts to the subject of the Spanish Economy, showing how digital resources increase student motivation and facilitate the assimilation of content in this type of subject. Therefore, evidence suggests that memes could be effective in assimilating concepts, illustrating theories and motivating students (Smith, 2017).
However, in addition to the teacher's perception, it is interesting to know the student's opinion about this type of activity, which is generally positive. Several authors have pointed out that students perceive these resources as more attractive and understandable, improving their communication skills and reinforcing their learning (Hayes and Fatima, 2024; Antón-Sancho et al., 2022). In addition, Suárez-Guerrero et al. (2022) have shown that students can express their understanding creatively and critically through them.
Based on the above, memes are an effective and adaptive digital tool in higher education, especially in conceptually complex fields, such as the economy. Specifically, it helps to synthesise complex ideas, stimulating students' interest and fostering the construction of their critical thinking. This makes memes a pedagogical strategy that responds effectively to the educational needs of contemporary students. However, we cannot ignore the fact that for their correct application, it is necessary to ensure that the specific academic objectives that we pursue with these activities are coherent with the general teaching-learning process.
3. MATERIALS AND METHODS
3.1. The subjects
This paper aims to study the application of new types of activities, such as memes, to replace the more traditional methods in students’ autonomous learning. This activity has been applied to two subjects: International Economics for Business and Spanish Economy.
The International Economics for Business subject is taught in the Double Bachelor's Degree in Law-Business Administration and contains general competences4 such as capacity for analysis and synthesis and capacity for communication and teamwork, and transversal competences related to the capacity to search for information and research and using information and telecommunication technologies.
On the other hand, the subject of Spanish Economics, which is taught in the Bachelor's Degree in Economics and its double degrees, adds5 the ability to solve problems (general competence) and to apply knowledge to practice (transversal competence).
Furthermore, both subjects include the completion and presentation of individual or group work at the teacher's discretion.
In view of these characteristics, the creation of a meme is within the limits and competences of the subject and combines in the same activity the general and transversal objectives included in the course syllabuses.
In previous academic years, the general practice has consisted of the elaboration of classic works: essays, data analysis, etc. However, it has been observed that student involvement is decreasing more and more in the development of this type of work, so the aim is to replace the more traditional work with a more modern one - the meme -. The aim is for the activity to motivate and stimulate students’ interest, while generating other types of skills and abilities that are more digital and connected to today's social media-based business world (Morisaki et al., 2023; Piñeiro-Otero and Martínez-Rolán, 2016).
3.2. The activity
The main objective of the activity is to transmit a course-related message (an opinion, concept, or idea) through a meme, while ensuring it is linked to contemporary economic issues. To that end, the following phases have been followed:
Phase 0. Initial questionnaire. The first day of the course, the students received all the information about the assignment (type of activity, deadline, form of assessment, etc.). After this explanation, an initial questionnaire was carried out face-to-face in the classroom to obtain a first perception of this activity considering they knew the essential details of the task but not how much time or effort they will have to invest in developing it. The instrument was specifically designed for this study, drawing on previous literature on innovative teaching methodologies and student perception analysis (Fernández et al., 2024; Ramos García y Caurcel Cara, 2009), and adapted to the context of meme-based learning in Applied Economics. The design follows a pre–post comparison approach, allowing the analysis of changes in students’ perceptions before and after the activity.
Specifically, the questionnaire consisted of 30 questions6 divided into two parts: general characteristics of the participant and aspects related to the activity. All questions were posed as statements to be answered on a Likert scale from 1 to 5, where 1 represented the highest level of disagreement with the statement and 5 represented the highest level of agreement. This first questionnaire serves as the baseline for comparing the students’ perceptions before and after the fulfilment of the activity (with a final questionnaire – see Phase 7).
Phase 1. Pairs and topic. During the first week of class, they had to voluntarily form pairs. Once the pair was formed, they had to choose the topic of the meme. For this, three general thematic lines related to both subjects were proposed: economic growth and GDP, the external sector and the productive structure. Each pair had to rank these topics in order of preference. The distribution of pairs by topic and grade can be seen in Table 1.
TABLE 1. DISTRIBUTION OF TOPICS BY NUMBER OF GROUPS
Number of pairs |
|||
Topic |
Double degree in Business Administration |
Double degrees in Economics |
Degree in Economics |
Economic growth and GDP |
7 |
6 |
6 |
External Sector |
8 |
7 |
5 |
Productive Structure |
7 |
6 |
5 |
Source: Own elaboration.
Phase 2. Elaboration. On the technical side, students were advised to watch tutorials on meme-making using web applications, as well as examine existing memes on economics to consider the transmission of information through them. The use of videos for meme-making was not recommended. In terms of content, students had to produce the meme by compiling information on the topic from different sources. The information had to be up to date in terms of the use of economic news and had to be linked to the subject matter. In addition, they were instructed that the meme had to be politically correct and could not be identified with any political group.
In summary, students had to: (1) establish the general purpose of the meme, choosing an image (bearing in mind the misappropriation of images), as well as the message they wanted to convey and the tone of the meme (reflective, situational or social); and (2) justify the meme by explaining the message they wanted to convey, the image they wanted to use and the connection of the result with the subject matter. Also, students can choose to use a template that has gone viral on social media and adapt it to the assigned subject content or create the meme from scratch by searching for or creating an image that has not been used on social media before.
Phase 3. Submission. Students had to submit two files in the corresponding assignment created through the virtual campus: the meme in JPG format and a report on the project. The latter had to consist of the following parts: (1) introduction specifying the objectives, (2) roles and tasks of the members of the group, (3) justification of the message to be transmitted, (4) justification of the image, and (5) sources.
Phase 4. Voting for the memes. Once the activity had been submitted, the memes were made public (anonymously) on the Virtual Campus of the subject corresponding to each degree. The students had to rank the memes of their classmates according to the ones they found most interesting through Google forms.
Phase 5. Presentation of the best memes. A day was set aside for the presentation of the best memes chosen by the students in Phase 4 before a tribunal of three teachers from the Department of Applied Economics, Structure and History. The presentation was not about the meme itself, but each member of the group had to explain (in about 3 minutes) how they had participated in the work and their experience during the activity. They answered questions such as: What was the most important challenge in the development of this activity? What do you think about the activity? Do you find the use of memes in this type of subject meaningful? What is the reason or inspiration for the selected image? Have you sought external feedback on the meme created (e. g. family, friends, etc.)?
Phase 6. Evaluation. The activity accounted for 10% of the final grade for the subject. To evaluate it, the items defined in Table 2 were considered.
TABLE 2. EVALUATION CRITERIA FOR THE ACTIVITY
CRITERIA |
WEIGHT |
Written message |
40% |
Image |
35% |
Originality and connection with current affairs |
15% |
Presentation |
10% |
Total |
100 |
Source: Own elaboration.
Phase 7. Final questionnaire. A second questionnaire is carried out at the end of the activity to check the perceptions of the students and, following Fernández et al. (2024), compare them with their initial perceptions. The questions posed are comparative in nature to the first questionnaire, as they have been designed to examine equivalent aspects before and after the activity has been carried out. This approach is particularly useful, firstly, for identifying specific student profiles and, secondly, for exploring, within those profiles, their preferences and perceptions of the activity (before and after).
In this case, 37 questions were developed7. These were divided into the following types: 30 questions posed as statements to be answered on a Likert scale from 1 to 5, where 1 represented the maximum disagreement and 5 represented the maximum agreement with the statement; 2 multiple choice questions where the student could select all the answers he/she considered relevant from a (short) list of options; 2 dichotomous questions (yes/no); and 3 open questions.
As with the initial one, this questionnaire was conducted face-to-face in the classroom to obtain the maximum number of participants possible.
4. RESULTS
In this section, the initial and final questionnaires (Phases 0 and 7 of the activity) are analysed, as well as the main grades and memes obtained.
As has been mentioned, students’ perceptions of the activity, both before and after its implementation in the classroom, were assessed through the two questionnaires. The initial questionnaire focuses on students’ characteristics and approach to the activity, while the final questionnaire addresses the activity itself, providing a broader view of students’ perceptions. Together, both questionnaires allow for comparison of relevant aspects of the activity, since they are connected. The questions are grouped into different groups (prior skills, opinion on the activity, etc.) and, additionally, each group of questions is divided into different aspects. See sections 4.1 and 4.2 for more information, and Appendix A.
Table 3 shows the relevant information on participation and student characteristics (age, gender, enrolment) by group. Regarding the characteristics of the students, the average age is similar in all groups, between 20 and 23 years old, and it can be said that practically all participants, with a few exceptions, are first-time students in the subject. As for the distribution by groups of participants, in the initial questionnaire the participation is quite balanced, while in the final questionnaire the students of the Double Degrees in Economics are the ones with the highest percentage of participation. In terms of gender distribution, there are more women in both questionnaires, with only one non-binary gender participant.
TABLE 3. GENERAL CHARACTERISTICS OF THE PARTICIPANTS
INITIAL QUESTIONNAIRE |
|||||||
Data |
DDB |
DDE |
E |
M |
W |
NB |
Total |
Participants |
29 |
30 |
32 |
35 |
55 |
1 |
91 |
% of total |
31.87% |
32.97% |
35.16% |
38.46% |
60.44% |
1.10% |
100% |
Average age |
20.07 |
21.20 |
20.53 |
20.60 |
20.58 |
22 |
20.60 |
First enrolment |
28 |
30 |
29 |
34 |
53 |
0 |
87 |
Second enrolment |
1 |
0 |
2 |
1 |
2 |
0 |
3 |
Third enrolment |
0 |
0 |
1 |
0 |
0 |
1 |
1 |
% of first-time enrolments |
96.55% |
100% |
90.63% |
97.14% |
96.36% |
0% |
95.60% |
FINAL QUESTIONNAIRE |
|||||||
Data |
DDB |
DDE |
E |
M |
W |
NB |
Total |
Participants |
9 |
15 |
7 |
14 |
16 |
1 |
31 |
% of total |
29.03% |
48.39% |
22.58% |
45.16% |
51.61% |
3.23% |
100.00% |
Average age |
20.11 |
21.27 |
20.57 |
20.79 |
20.63 |
23 |
20.77 |
First enrolment |
9 |
15 |
6 |
13 |
16 |
1 |
30 |
Second enrolment |
0 |
0 |
1 |
1 |
0 |
0 |
1 |
Third enrolment |
0 |
0 |
0 |
0 |
0 |
0 |
0 |
% of first-time enrolments |
100.00% |
100.00% |
85.71% |
92.86% |
100.00% |
100.00% |
96.77% |
Participants in the initial questionnaire |
9 |
13 |
5 |
11 |
15 |
1 |
27 |
% of participation in the initial questionnaire |
100% |
86.67% |
71.43% |
78.57% |
93.75% |
100% |
87.10% |
Notes: (1) DDB - Double Bachelor’s Degree in Law-Business Administration; DDE - Double Bachelor’s Degree in Economics-International Relations and the Double Bachelor’s Degree in Management and Public Administration-Economics; E - Bachelor’s Degree in Economics; M – Men; W – Women; NB – non-binary.
(2) One participant was removed from the initial questionnaire and another from the final questionnaire, so results presented in Tables 3 and 5 consider 90 and 30 participants respectively. Additionally, some sections presented in Tables 3 and 5 have a lower number of participants due to blank responses. Specifically, in the initial questionnaire, four subsections have 89 participants (OPINION ON THE ASSESSMENT FORMAT - continuous assessment; OPINION ON THE ACTIVITY - capturing interest; OPINION ON THE ACTIVITY - difficulty; OPINION ON THE ACTIVITY - helping to develop skills), while in the final questionnaire, two subsections have 29 participants (OPINION ON THE DEVELOPMENT OF THE ACTIVITY - resolution of problems; FEEDBACK ON THE RESULTS OF THE ACTIVITY - evaluation).
Source: Own elaboration.
It is also important to analyse the participation in both questionnaires, as the difference is important. In the initial questionnaire, there were a total of 91 participants, while in the final questionnaire, there were only 1/3 (31 participants). This significant drop in participation was because the questionnaire was passed on the last day of class, when attendance was much lower than usual. However, although participation in the second questionnaire was lower, most students had participated in the first questionnaire -around 90%- which allows us to compare the responses from one questionnaire to the other.
4.1. Results of the initial questionnaire
All the information related to the initial questionnaire is included in Table 48. As mentioned previously, the information is divided according to: 1) social skills; 2) general skills; 3) opinion on the assessment format, and 4) opinion on the activity. Each one is divided in turn in different issues. See Appendix A for more information.
TABLE 4. INITIAL QUESTIONNAIRE. MAIN RESULTS
POSITIVE |
INDIFFERENT |
NEGATIVE |
||
SOCIAL SKILLS |
EXTROVERSION |
46.7% |
38.9% |
14.4% |
VOICE |
81.1% |
15.6% |
3.3% |
|
RELATIONSHIPS IN THE CLASSROOM |
44.4% |
0.0% |
55.6% |
|
GROUP WORK PREFERENCE |
73.3% |
0.0% |
26.7% |
|
GENERAL SKILLS |
CONCENTRATION |
81.1% |
16.7% |
2.2% |
INTEREST IN STUDIES |
85.6% |
10.0% |
4.4% |
|
TECHNIQUES (CONTENT CREATION) |
7.8% |
34.4% |
57.8% |
|
OPINION ON THE ASSESSMENT FORMAT |
CONTINUOUS ASSESSMENT |
62.9% |
21.3% |
15.7% |
INNOVATIVE TECHNIQUES |
96.7% |
0.0% |
3.3% |
|
OPINION ON THE ACTIVITY |
CAPTURING INTEREST |
100.0% |
0.0% |
0.0% |
DIFFICULTY |
85.4% |
0.0% |
14.6% |
|
HELPING TO PASS THE SUBJECT |
90.0% |
0.0% |
10.0% |
|
HELPING TO DEVELOP SKILLS |
75.3% |
20.2% |
4.5% |
Note: Light grey: values higher than 50%. Dark grey: values higher than 75%. Bold: values higher than 90%.
Source: Own elaboration.
Social skills are divided into four main characteristics of the students: extroversion, voice, relationships in the classroom and group work preference. The first two refer to how the student wants to be part of the class: more unnoticed or not. In this case, it seems that in general students are extroverted (46.7%) and like to have and defend their own opinions with the rest of their colleagues (81.1%). The third characteristic show that 44.4% of the students like to know and connect with all the students in the classes, while the other 55.6% show that they prefer to work with each other as close colleagues. Finally, 73.3% of the students show that they prefer to work in a group.
General skills refer to some technical skills (mainly related to content creation) as well as other relevant characteristics that determine the effort of the students (concentration and interest in studies). The results show that students are focused on the acquisition of the knowledge transmitted in the classes (81.1%) and have an interest in passing the different subjects and attending the different classes (85.6%). However, they do not have skills in content creation since 57.8% of the participants manifest a negative response.
Related to the opinion on the assessment, 62.9% of the students are in favour of the continuous assessment and with the application in the class of this type of innovative activities (96.7%).
The opinion on the activity has been the block of questions with a more positive evaluation of the students. Students consider that these types of activities capture the interest in the content of the subjects (100%), although 85.4% consider that the activity may be difficult and imply too much time. A high percentage of participants think that the activity will help them not only to pass the subject (90%) but also to develop skills that will be useful in the future (75.3%).
4.2. Results of the final questionnaire
Table 5 shows the main results obtained in the second questionnaire carried out after the activity.
TABLE 5. FINAL QUESTIONNAIRE. MAIN RESULTS
POSITIVE |
INDIFFERENT |
NEGATIVE |
||
PRIOR SKILLS |
SOCIAL |
53.3% |
43.3% |
3.3% |
TECHNICAL |
50.0% |
0.0% |
50.0% |
|
GENERAL PERCEPTION OF THE ACTIVITY |
DEGREE OF NOVELTY |
100.0% |
0.0% |
0.0% |
DEGREE OF INTEREST |
96.7% |
0.0% |
3.3% |
|
LEVEL OF PREFERENCE (in relation to other activities carried out in the degree) |
96.7% |
0.0% |
3.3% |
|
OPINION ON THE DEVELOPMENT OF THE ACTIVITY |
TASKS |
93.3% |
0.0% |
6.7% |
PROBLEMS WITH THE WORKING GROUP |
6.7% |
0.0% |
93.3% |
|
RESOLUTION OF PROBLEMS |
100.0% |
0.0% |
0.0% |
|
FEEDBACK ON THE RESULTS OF THE ACTIVITY |
DIFFICULTY |
26.7% |
20.0% |
53.3% |
DEVELOPMENT OF SKILLS |
86.7% |
10.0% |
3.3% |
|
MATERIALS |
96.7% |
0.0% |
3.3% |
|
EVALUATION |
65.5% |
34.5% |
0.0% |
Note: Light grey: values higher than 50%. Dark grey: values higher than 75%. Bold: values higher than 90%.
As in the initial questionnaire, questions are divided into four groups, each one divided into different sub-groups (see Appendix A for more information). In this case, the general groups are: 1) prior skills; 2) general perception of the activity; 3) opinion on the development of the activity, and 4) feedback on the results of the activity.
Regarding prior skills, most of the participating students have social skills, while in the case of technical skills, half of the respondents would have done such a type of activity, while the other 50% would be inexperienced in creating this kind of content.
In addition, the general perception of the activity (degree of novelty, degree of interest in the subject, preference of this activity over others carried out in the degree in other subjects) was very positive, with almost all the respondents.
Specifically, concerning the opinion on the development of the activity, more than 90% of the participants consider that the distribution of tasks has been adequate. There were some few students who reported inconveniences when working with their classmates (6.7%), all participants agreed that both the materials and professors helped them to solve the potential problems.
Focusing on the feedback on the results of the activity, less than 30% of the participants reported that the activity would have been difficult. More than 85% consider that the activity has largely helped them to develop technical skills, which would be useful in the future. Additionally, materials submitted on the activity have been adequate (more than 85% of the participants have a positive response) and, in general, the students have been satisfied with their results (65.5%).
In this questionnaire, there are no notable differences either by degree or by gender in the opinion on the development of the activity; however, there are differences, both by degree and by gender, in the prior skills of the participants (Figure 2), and by sex concerning the general perception of the activity (Figure 3).
FIGURE 2. PRIOR SKILLS BY DEGREE AND SEX
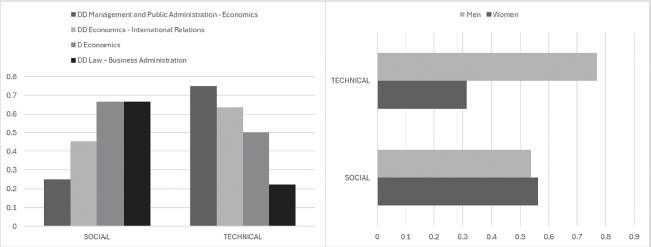
Notes: DD – Double Degree; D – Degree.
Only one person has identified as “non-binary,” so they have been excluded from the gender-based analysis in the figure. This person reports having negative skills, both social (shyness) and technical (had not created similar content before).
Source: Own elaboration.
FIGURE 3. GENERAL PERCEPTION OF THE ACTIVITY BY SEX
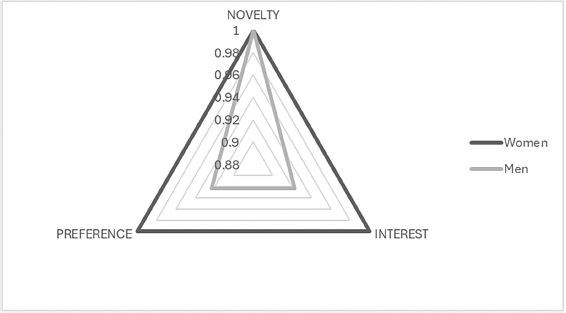
Source: Own elaboration.
Figure 2 shows that the degrees in Economics (both simple and the double degrees) are identified with more technical skills, while the double degree in Law and Business Administration is identified with more social skills. It is worth mentioning that the Degree in Economics and the Double Degree in Economics-International Relations are the most balanced ones, having both skills without an excessively large difference. Additionally, if we look at the situation by gender in Figure 2, we can observe that men are characterised by more technical skills and, while the opposite is observed for women.
On the other hand, Figure 3 shows the differences by gender in the general perception of the activity. For female students, the general perception of the activity is much more positive rather than male participants.
Furthermore, an analysis by gender and degree of the students' perception of materials and evaluation (within the feedback on the results) deserves special attention. This is detailed in Figure 4.
FIGURE 4. MATERIALS AND EVALUATION (FEEDBACK ON THE RESULTS OF THE ACTIVITY) BY DEGREE AND SEX
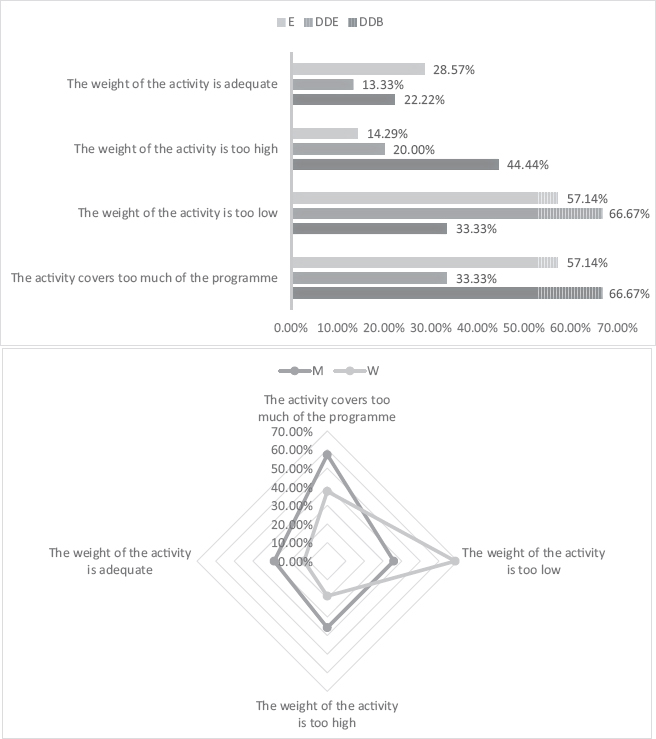
Note: DDB – Double Bachelor’s Degree in Law-Business Administration; DDE – Double Bachelor’s Degree in Economics-International Relations and the Double Bachelor’s Degree in Management and Public Administration-Economics; E – Bachelor’s Degree in Economics; M – Men; W – Women.
Source: Own elaboration.
As can be seen, if we look at the differences by gender, the main problem of the activity for men is that it covers too much material. This problem is identified, if we look at the different degrees, by the degree in Economics and the double degree in Law and Business Administration and Management. In the case of women, the main problem was that they considered the weight of the activity to be low. By degree, this problem was identified by the Economics degree (both simple and the double degrees) but not by the double degree in Law and Business Administration and Management, which considered that the weight of the activity on the subject was very high.
Finally, it is important to note that some participants in the final questionnaire left additional comments on the activity. Table 6 summarizes them in two categories and by the tone of the message (supportive, neutral, critical).
TABLE 6. ADDITIONAL COMMENTS ABOUT THE ACTIVITY EXPRESSED IN THE FINAL QUESTIONNAIRE
Category |
Opinion |
||
Supportive |
Neutral |
Critical |
|
General Evaluation & Scheduling |
“Great activity”, “Good activity”, “Very good activity”, “Very interesting work” |
“It would be more fun to present one meme each day instead of all at once” |
“Bad timing for the presentation”, “The effort should be more reflected in the grade” |
Creativity, Dynamics & Learning |
“I found it interesting and different”, “A useful tool to internalize concepts”, “It depends on the mood of the group, but it’s fun” |
“I struggle to be creative” |
- |
Source: Own elaboration.
As can be seen, the comments on the activity are mostly supportive, especially in terms of overall assessment and learning. However, some of the comments identified opportunities for improvement in the scheduling and method of presenting the final results.
4.3. Grades
Table 7 collects the final grades of the activity by group following the evaluation criteria for the activity (see Table 2). All grades are given on a scale of 10. To obtain the final grade, a weighted average of the grades has been obtained.
TABLE 7. GRADES OBTAINED (AVERAGE)
Criteria |
DD Business Administration |
DDs Economics |
D Economics |
Written message |
8.24 |
8.82 |
7.56 |
Image |
8.51 |
9.53 |
9.46 |
Originality and connection with current affairs |
6.82 |
9.66 |
9.64 |
Presentation |
8.00 |
9.43 |
9.60 |
Total |
7.31 |
8.66 |
8.08 |
Notes: DD – Double Degree; D – Degree.
The grade for the presentation corresponds to the average of the groups chosen by the students in the voting. For the rest of the sections, the average is for the total number of groups.
Source: Own elaboration.
In general terms, the double degree in Economics obtained the highest score (8.66), followed by the degree in Economics (8.08) and the double degree in Law and Business Administration and Management (7.31).
Analysing the four criteria, in written message (which represents 40% of the evaluation), the double degree in Economics leads the list with 8.82, while the degree in Economics has the lowest score (7.56). It indicates that the latter needs to improve in clarity and effectiveness of the message. In the image criterion (35% of the final grade), the Economics degrees (both single and the double degrees) stand out with grades above 9.4, while the double degree in Law and ADE lagged with 8.51, suggesting that the visual part of the memes in this group has been less impactful than in the rest.
The criterion of originality and connection with current affairs (15%) shows a clear advantage for the Economics degrees (both single and the double degrees), with scores of 9.66 and 9.64, while the double degree in Law and Business Administration and Management received only 6.82. Finally, in presentation (10%), all categories have a strong performance, but again the double degree in Law and Business Administration has the lowest score (8.00).
In conclusion, the Economics degrees (both single and the double degrees) have a better overall performance, perhaps due to the broader and more basic training on economic concepts.
4.4. Memes
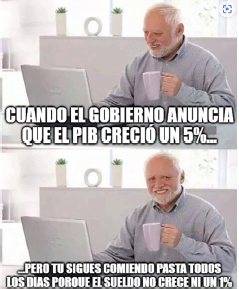
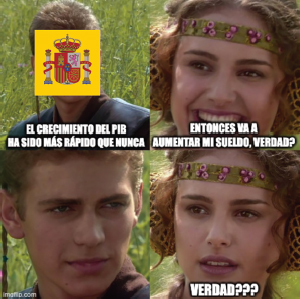
Tables 8, 9 and 10 give some examples of the memes9 produced by students by group on economic growth and GDP, the external sector and the productive structure respectively.
TABLE 8. EXAMPLES OF MEMES ON GDP AND ECONOMIC GROWTH
|
|
|
Double degree in Business Administration |
Double degrees in Economics |
Degree in Economics |
Students: Mencía Rey* |
Students: Carlos Álvarez and José Luis Ortíz |
Students: Mª de los Ángeles González and Lua Ye Wu |

Source: Own elaboration from students’ memes.
* Another student co-authored the meme, but authorisation to publish their name was not obtained.
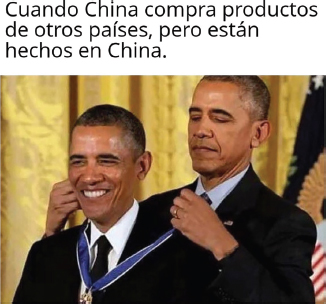
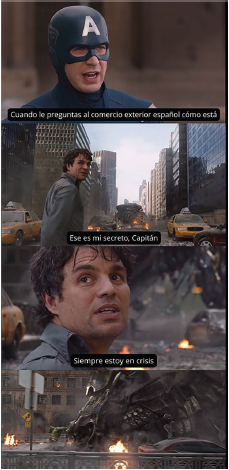
TABLE 9. EXAMPLES OF MEMES ON EXTERNAL SECTOR
|
|
|
Double degree in Business Administration |
Double degrees in Economics |
Degree in Economics |
Students: Ámbar Bascones* |
Students: Elena González and Irene Talavera |
Students: Adriana Rodríguez-Saá and Elsa Roselló |

Source: Own elaboration from students’ memes.
* Another student co-authored the meme, but authorisation to publish their name was not obtained.
TABLE 10. EXAMPLES OF MEMES ON PRODUCTIVE STRUCTURE
|
|
|
Double degree in Business Administration |
Double degrees in Economics |
Degree in Economics |
Students: Noelia Cámara and Roberta Comsa |
Students: Alejandro Huerta and David Pérez |
Students: Mª del Carmen Lorente and Eva Ortega |
Source: Own elaboration from students’ memes.
Regarding the memes presented on economic growth and GDP, the aim of all three is to show the loss of purchasing power in Spanish society at present through humour. Moreover, in the reports, the students allude to specific data on the Spanish economy (in some cases with a historical perspective). Therefore, they show not only their success in finding reliable data and information but also their knowledge of economic concepts such as GDP growth, productivity and inflation and how they relate to each other.
In relation to the memes shown on the external sector, they focus especially on the field of international trade. The three memes show how this is affected by globalised manufacturing, the stability of economies and even international policy, interpreting economic information in a critical and creative way. Moreover, the information provided by the students in the reports and the memes shows the understanding of key concepts such as global value chains, tariffs or trade agreements.
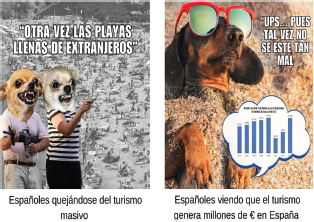
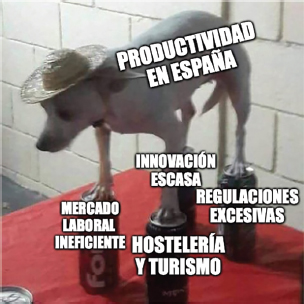
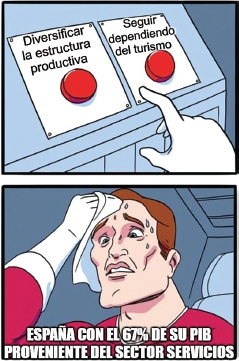
Finally, in the case of the memes on the productive structure, we observe a greater interest among students in Spain's high dependence on the services sector and, especially, on tourism. The meme produced by the students on the double degree in Business Administration includes a graph with data taken from official sources, showing the appropriate handling of data and information, as well as basic Excel tools. In general, the students who have worked on this topic have criticised Spain's lack of productive diversification, based on relevant economic concepts such as productivity, specialisation and productive diversification.
In addition, it is important to note that, as shown in the tables, some students chose to create memes using images that had already gone viral on social media. For example, this was the case with the meme created by students of the Double Degree in Business Administration on GDP and economic growth (Table 8). However, other groups opted to create original images based on content they found online, without relying on previously viral memes. This was the case for the representative meme created by students of the Degree in Economics on the external sector (Table 9), and the one by students of the Double Degree in Business Administration on the theme of the productive structure (Table 10).
5. CONCLUSIONS
The analysis of the activity based on memes within the teaching of applied economics reflects a positive perception on the part of the students, highlighting the value of this methodology as an innovative and fun way of learning. The activity demonstrates that memes can be an effective vehicle for the dissemination of economic ideas, as they simplify complex concepts and make them more accessible to students. Moreover, this approach not only facilitates learning, but also allows for reflection and critique of current economic circumstances, encouraging critical thinking and the analysis and interpretation of data.
This activity shows that incorporating new teaching formats can enrich the educational process, as has been pointed out by other authors (Awidi et al., 2019; Brenley and Coven, 2018; Kozma, 2003). In addition, by integrating memes as a pedagogical tool, a more dynamic and participatory classroom environment is fostered, encouraging students to become actively involved in their own learning and with the subject itself (Guadarrama Herrera et al., 2020; Dynel, 2022). The positive perceptions given to the activity by students reinforce the idea that this type of tools can effectively complement traditional methodologies in teaching, promoting not only learning skills but also technical and social (Hayes and Fatima, 2024; Antón-Sancho et al., 2022).
The results also note differences between students according to their degree and gender, suggesting that the way students perceive and adapt to these types of dynamics varies according to their academic and personal backgrounds. These differences highlight the importance of designing activities that balance both types of skills, allowing each group to develop the skills in which they are less remarkable and to strengthen those in which they already have some background.
The main contributions of our work are several. Firstly, this work adds evidence of how this type of innovative methodologies has great potential in university teaching, as it facilitates the understanding of complex concepts. Second, it shows that the integration of digital tools and creative formats motivates students and involves them in their own learning process. Finally, this research provides empirical evidence on the use of memes in the teaching of applied economics (which has not been used until now), which could serve as a reference for future pedagogical initiatives in other disciplines.
However, it is important to recognise certain limitations in the implementation of the activity. The main limitation is the significant decrease in participation in the final questionnaire, suggesting the need for strategies to ensure greater representativeness in future research. This reduction in participation may introduce a potential non-response bias, as students who were more engaged with the activity or had a more positive perception of it may have been more likely to complete the final questionnaire, while less motivated or less satisfied students may have chosen not to respond. In this sense, the results obtained could be subject to a self-selection effect, potentially leading to an overestimation of the positive evaluations reported. Therefore, the findings should be interpreted with caution, as they may not fully represent the perceptions of the entire group of students. This decrease in participation could be related to external factors, such as the date of application of the questionnaire or the students’ academic load at the end of the course, aspects that should be considered in future methodological designs. In addition, future research should consider implementing strategies aimed at increasing response rates, such as administering the questionnaire during class time or providing incentives for participation, in order to improve the robustness and representativeness of the results. In addition, future studies could explore the implementation of these activities in other disciplines, considering the above-mentioned limitations.
6. FUNDING
This research has not received external funding.
7. AUTHOR CONTRIBUTIONS
Conceptualización, Claudia García-García, Sara Fernández y Celia Torrecillas; Metodología, Claudia García-García, Sara Fernández y Celia Torrecillas; Obtención de datos, Claudia García-García, Sara Fernández y Celia Torrecillas; Análisis de datos, Claudia García-García, Sara Fernández y Celia Torrecillas; Redacción - Preparación del borrador original, Claudia García-García, Sara Fernández y Celia Torrecillas; Redacción - Revisión y edición, Claudia García-García, Sara Fernández y Celia Torrecillas; Supervisión, Claudia García-García, Sara Fernández y Celia Torrecillas.
8. REFERENCES
Antón-Sancho, Á., Nieto-Sobrino, M., Fernández-Arias, P., & Vergara-Rodríguez, D. (2022). Usability of memes and humorous resources in virtual learning environments. Education Sciences, 12(3), 208. https://doi.org/10.3390/educsci12030208
Awidi, I. T., Paynter, M., & Vujosevic, T. (2019). Facebook group in the learning design of a higher education course: An analysis of factors influencing positive learning experience for students. Computers & Education, 129, 106-121. https://doi.org/10.1016/j.compedu.2018.10.018
Botts, M. M. (2024). Learning in Space–Using Science Fiction Podcasts in and out of the Marketing Classroom. Marketing Education Review, 34(2), 164-171. https://doi.org/10.1080/10528008.2024.2336466
Brenley, D. B., & Covey, J. (2018). Risky behaviour via social media: the role of reasoned and social reactive pathways. Computers in Human Behaviour, 78, 183-191. https://doi.org/10.1016/j.chb.2017.09.036
Brown, R., & Maudlin, D. (2012). Concepts of vernacular architecture. In C. G Crysler, S. Cairns, & H. Heynen (Eds.), The SAGE handbook of architectural theory (pp. 340-355). SAGE Publications. ISBN: 978-1412946131.
Castro, A. C. C., & López, P. F. C. (2023). Los memes dentro de las luchas de violencia de genero: limitantes del humor y la reflexion. Punto de vista, 14(21), 81-99. Retrieved from: https://revistas.poligran.edu.co/index.php/puntodevista/article/view/4050/4330
Dawkins, R. (1989). The Selfish Gene (2nd ed.). Oxford University Press. ISBN: 9780192177735.
Dawkins, R. (2006). The Selfish Gene 30th Anniversary Edition (3rd ed.). Oxford University Press. ISBN: 9780191537554.
De Haro, J. J. (2010). Redes sociales en educación. In C. Naval, S. Lara, C. Ugarte, & C. Sádaba (Eds.), Educar para la comunicación y la cooperación social (pp. 203-216). Publicaciones del Consejo Audiovisual de Navarra. ISBN: 978-84-614-4234-8.
Dongqiang, X., De Serio, L., Malakhov, A., & Matys, O. (2020). Memes and education: opportunities, approaches and perspectives. Geopolitical, Social Security and Freedom Journal, 3(2), 14-25. https://doi.org/10.2478/gssfj-2020-0009
Dynel, M. (2022). La vida de los memes de mascarillas del COVID-19: Un estudio diacrónico del panorama memético durante la pandemia. Comunicar: Revista Científica de Comunicación y Educación, 72. https://doi.org/10.3916/C72-2022-06
Fernández, S., García-García, C., & Torrecillas, C. (2024). El uso del podcast en Economía Española. Revista de Estudios Empresariales. Segunda Época, 2024(1), 73-93. https://doi.org/10.17561/ree.n1.2024.8210
Forner Marqués, R. (2021). ¿Qué es un meme? Manual para la identificación de memes. Una propuesta de categorización. Degree dissertation (Final Degree Project; Mentoring: Pastor Aguilar, M.), Universitat Politècnica de València. Retrieved from: https://riunet.upv.es/bitstream/handle/10251/173398/Forner%20-%20QUE%20ES%20UN%20MEMEMANUAL%20PARA%20LA%20IDENTIFICACION%20DE%20MEMES%20UNA%20PROPUESTA%20DE%20CATEGORIZACION.pdf
Guadarrama Herrera, A., Mendoza Guadarrama. C., Díaz Silva, J., & Becerril Morales, F. (2020). El uso de los memes como estrategia didáctica aplicada en las Matemáticas. Cultura Digital y Desarrollo Humano, 4(4), 18-26. Retrieved from: https://drpabloglezcasanova.uaemex.mx/culturadigitalydesarrollo/docs/A1/pdf/Libro_2020.pdf
Hayes, B., & Fatima, S. (2024). ‘A language we understand’: Students’ perceptions of emojis, memes and gifs in higher education teaching. Student Engagement in Higher Education Journal, 5(3), 154-177. Retrieved from https://sehej.raise-network.com/raise/article/view/1187
Ibañez, M. F. (2019). Memes 2.0, una nueva forma de comunicación. Sociales y virtuales, 6. Disponible en RIDAA-UNQ. Repositorio Institucional Digital de Acceso Abierto de la Universidad Nacional de Quilmes http://ridaa.unq.edu.ar/handle/20.500.11807/3747
Kozma, R. B. (2003). Technology and classroom practices: An international study. Journal of Research on Technology in Education, 36(1), 1-14. https://doi.org/10.1080/15391523.2003.10782399
Ligarretto, R. (2020). Meme educativo: experiencia para una pedagogía de la cultura visual. Revista Educación y Ciudad, 39, 131-145. https://doi.org/10.36737/01230425.n39.2020.2341
Lonnberg, A., Xiao, P., & Wolfinger, K. (2020). The growth, spread, and mutation of internet phenomena: A study of memes. Results in Applied Mathematics, 6, 100092. https://doi.org/10.1016/j.rinam.2020.100092
Marín-Diaz, V., & Cabero-Almenara, J. (2019). Las redes sociales en educación: ¿desde la innovación a la investigación educativa? RIED. Revista Iberoamericana de Educación a Distancia, 22(2), 25-33. https://doi.org/10.5944/ried.22.2.24248
Morisaki, J. D., Morisaki, F. P., Morisaki, J. C., & Quispe, R. N. (2023). La cultura de los memes en la actualidad y su impacto en la sociedad y educación. Hacedor, 7(2), 210-224. https://doi.org/10.26495/rch.v7i2.2532
Navrouzoglou, P., Kushwah, L., & Selvaretnam, G. (2024). Using a Group Podcast and Policy Brief in an Economics Undergraduate Course to Enhance Sustainability Literacy, Communication and Teamwork Skills. In Sustainability in Business Education, Research and Practices (pp. 41-62). Cham: Springer Nature Switzerland. https://doi.org/10.1007/978-3-031-55996-9_4
Pinto, L. G. A. (2019). Posibilidades del ecosistema digital desde una mirada comunicativo-pedagógica: reflexiones en torno a la elaboración de memes académicos. In Viralizar la educación: Red de experiencias didácticas en torno al meme de Internet (pp. 15-37). Pontificia Universidad Católica de Ecuador. ISBN: 978-9942-8770-0-0.
Piñeiro-Otero, T., & Martínez-Rolán, X. (2016). Understanding Digital Marketing - Basics and Actions. In C. Machado, & J. Davim (Eds.), MBA. Management and Industrial Engineering. Springer. https://doi.org/10.1007/978-3-319-28281-7_2
Ramos García, A. M., & Caurcel Cara, M. J. (2009). Cuestionario de valoración de la utilidad de los podcast como herramienta de enseñanza-aprendizaje. Proyecto de Innovación Docente “La tarea colaborativa y las nuevas tecnologías para la mejora de la competencia oral en LE”, Universidad de Granada. Retrieved from: http://hdl.handle.net/10481/75287
Rex, L., & Woywod, C. (2014). Envisioning home, self, and community through vernacular art environments. Art Education, 67(6), 40-46. https://doi.org/10.1080/00043125.2014.11519297
Rodríguez Guevara, J. E. (2021). Integración de las Tecnologías de la Información y la Comunicación en los procesos de enseñanza-aprendizaje. RIESED: Revista Internacional de Estudios sobre Sistemas Educativos, 3(11), 99-111. Retrieved from: https://www.riesed.org/index.php/RIESED/article/view/140
Salinas, J. (2004). Innovación docente y uso de las TIC en la enseñanza universitaria. RUSC, Universities & Knowledge Society, 1(1).
Smith, E. E. (2017). Social media in undergraduate learning: categories and characteristics. International Journal of Educational Technology in Higher Education, 14, 1-24. https://doi.org/10.1186/s41239-017-0049-y
Solon, O. (2013). Richard Dawkins on the internet’s hijacking of the word ‘meme’. Wired UK, 20. Retrieved from: http://res.tigerge.cn/20200330/%E8%A1%A5%E5%85%852%20Richard%20Dawkins%20on%20the%20internet's%20hijacking%20of%20the%20word%20'meme'.pdf
Suárez-Guerrero, C., Passeron, E. Herrera-Urízar, G., & Gamboa Cordero, Y. M. (2022). Memes como instrumento de evaluación del aprendizaje. Un caso en la universidad. REDU. Revista de Docencia Universitaria, 20(2), 165-180. https://doi.org/10.4995/redu.2022.18551
Tidy, H., Bolton-King, R. S., Croxton, R., Mullen, C., Nichols-Drew, L., Carlysle-Davies, F., Moran. K. S., & Irving-Walton, J. (2024). Enhancing the student learning experience through memes. Science & Justice, 64(3), 280-288. https://doi.org/10.1016/j.scijus.2024.03.004
Urbina, N. (2005). El arte conceptual: punto culminante de la estética procesual o el arte como proceso. Estética, 6. Retrieved from: https://www.academia.edu/4112749/Neida_Urbina_El_arte_conceptual_Punto_culminante_de_la_estetica_procesual_o_el_arte_como_proceso01
Wallace, I. (2014). What is post-internet art? Understanding the revolutionary new art movement. Artspace Magazine Trend Report, 18. Retrieved from: https://www.artspace.com/magazine/interviews_features/trend_report/post_internet_art-52138
APPENDIX A. DISTRIBUTION OF QUESTIONS
This appendix presents the distribution of the questions posed as statements to be answered on a Likert scale from 1 to 5, used for the elaboration of Tables 4 and 5. Particular questions from both the initial and final questionnaires are available on request from the authors of this paper.
INITIAL QUESTIONNAIRE: 30 questions in total.
- Social skills: 10 questions
- Extroversion: 2 questions
- Voice: 2 questions
- Relationships in the classroom: 3 questions
- Group work preference: 3 questions
- General skills: 6 questions
- Concentration: 2 questions
- Interest in studies: 2 questions
- Techniques (content creation): 2 questions
- Opinion on the assessment format: 5 questions
- Continuous assessment: 2 questions
- Innovative techniques: 3 questions
- Opinion on the activity: 9 questions
- Capturing interest: 3 questions
- Difficulty: 3 questions
- Helping to pass the subject: 1 question
- Helping to develop skills: 2 questions
FINAL QUESTIONNAIRE: 30 questions in total.
- Prior skills: 3 questions
- Social: 2 questions
- Technical: 1 question
- General perception of the activity: 5 questions
- Degree of novelty: 1 question
- Degree of interest: 2 questions
- Level of preference (in relation to other activities carried out in the degree): 2 questions
- Opinion on the development of the activity: 7 questions
- Tasks: 1 question
- Problems with the working group: 3 questions
- Resolution of problems: 3 questions
- Feedback on the results of the activity: 15 questions
- Difficulty: 4 questions
- Development of skills: 4 questions
- Materials: 3 questions
- Evaluation: 4 questions
_______________________________
* Corresponding author: celiatorrecillas@ucm.es
1 ORCID: https://orcid.org/0000-0002-9311-9814
2 ORCID: https://orcid.org/0000-0002-6441-7097
3 ORCID: https://orcid.org/0000-0003-0439-6025
4 All the competences relating to the Double Degrees in Business Administration at the Complutense University of Madrid can be found at the following link: https://www.ucm.es/estudios/grado-adeingles-estudios-competencias. In the case of the subject International Economics for Business, the specific competences are included in the course syllabus, which can be consulted at the following link: https://drive.google.com/file/d/0Bwa1A30pN0IwTDVhb3ZjeVYydGM/view?resourcekey=0-3Crmjjz2ednwqTsdc5uoaA
5 All the competences relating to Bachelor's Degree in Economics and its double degrees at the Complutense University of Madrid can be found at the following link: https://www.ucm.es/estudios/grado-economiaeningles-estudios-competencias. In the case of the subject Spanish Economy, the specific competences are included in the course syllabus, which can be consulted at the following link: https://drive.google.com/file/d/0Bwa1A30pN0IwRTVKUFRLS1VuUE0/view?resourcekey=0-V2mzTy3XVvcRULZFhaS5lg
6 Two additional control questions are also included, designed to determine whether the students had been honest (frankness) and had been able to answer the questions clearly (comprehension).
7 As for the initial questionnaire, two additional control questions are also included to check frankness and comprehension.
8 It should be mentioned that we did not find differences considering the different degrees and by sex.
9 The memes are in Spanish since that is the language of the subjects.