FIGURE 1. FUNDAMENTAL VARIABLES OF EXPLANATION.

Source: Own construction. Based on Kebriaee-zadeh et al. (2013).
STOCK PRICE PERFORMANCE OF PHARMACEUTICAL COMPANIES: PRE-VACCINE COVID-19 - POST-VACCINE COVID-19
COMPORTAMIENTO DEL COSTO DE LAS ACCIONES DE LAS FARMACÉUTICAS PREVACUNA COVID-19 POSVACUNA COVID-19.
Henry Daniel Vera Ramírez (SENA-CFS; Colombia)*
Ferly Antonio Valencia Serna (SENA-CFS; Colombia)**
Abstract
This paper performs an analysis of the behaviour of the shares of the main pharmaceutical companies that research to obtain vaccines with a high degree of efficacy for COVID-19. A multiple regression econometric model is proposed, which relates stock prices to the impact of vaccine development on stock prices, including a dummy variable -over the time series- in the analysis. The results suggest significant associations between some pharmaceutical companies that developed vaccines in record time in the period analysed and an impact on the sector’s earnings performance.
Keywords: pharmaceuticals, share price, portfolio, COVID-19.
JEL Classification: B23, C02, D53, L65
Resumen
El presente trabajo, realiza un análisis del comportamiento de las acciones de las principales farmacéuticas que realizan investigaciones para obtener vacunas con un alto grado de eficacia para el COVID-19. Se propone un modelo econométrico de regresión múltiple, que relaciona los precios de las acciones con el impacto que tiene sobre los mismos el desarrollo de las vacunas. Para ello se incluye en el análisis una variable dummy -sobre la serie de tiempo-. Los resultados sugieren asociaciones importantes entre algunas empresas farmacéuticas que desarrollaron las vacunas en tiempo récord en el periodo de tiempo analizado y un impacto en los rendimientos y ganancias del sector.
Palabras clave: farmacéuticas, precio de acciones, portafolio, COVID-19.
Clasificación JEL: B23, C02, D53, L65
1. INTRODUCTION
The financial returns of many of the pharmaceutical companies have probably been observed in the emergence of the pandemic, a perspective that is directed towards the substantial improvement of health conditions accompanied by better income and a revitalization of the stock market as a result of the advance of different vaccines. The pandemic, therefore, generated a scientific race very similar, - keeping the proportions -, to the one in which the Soviets and the Americans competed for the arrival to space. In this sense, the research and development elements of the different vaccines are associated with oligopolistic markets that have traditionally been considered companies with a long tradition in the development of drugs, with new actors and associations between them, seeking to obtain results in the very short term and allowing the economic growth of the sector. In this sense, the perspectives of different works have focused on establishing the influence on the achievement of the vaccine, the market price level, and the price of the shares of the companies that develop these biologics.
The pharmaceutical industry reached a sales level of 1.2 trillion dollars on average each year (Speights, 2021)1. Undoubtedly, it is a great opportunity for investors to achieve significant returns in the long term. COVID-19, in turn, has generated greater attention to the industry, mainly those that initially had been candidates for the development of the vaccine. Investing in pharmaceutical companies is currently one of the most interesting markets, without denigrating the intrinsic risk involved in investing in a sector that must incorporate highly trained human capital and that must resolve its successes and failures in periods much longer than those of traditional markets. Investors in this sector generally focus on these companies because they consider them to be solid over the long term.
Since 2006, SPDR funds, or so-called spider funds, listed in the United States, Europe, and Asia-Pacific, have become an investment option managed by SSGA (State Street Global Advisors) and are generally associated with a particular market. The SPDR S&P Pharmaceutics, for example, is a sector-oriented fund that has demonstrated significant returns. Adjacent products are undoubtedly high-value products as a social asset. Drugs are a product, which, although not placed in the basket as a commodity, can become in many cases of complicated diseases, orphan diseases, or complex treatments in fundamental assets. Medical advances in the development of drugs for different health conditions have allowed a significant increase in the returns of several of these companies. The following table shows the returns of four of the main emporiums of the industry in the world:
TABLE 1. BENEFITS OF SOME PHARMACEUTICS.
Company |
Revenue (2019) |
Earnings (2019) |
AbbVie |
$33.3 billion* |
$7.9 billion |
Bristol Myers Squibb |
$26.1 billion |
$3.4 billion |
Johnson & Johnson |
$82.1 billion |
$15.1 billion |
Pfizer |
$51.8 billion |
$16.3 billion |
Source: Speights (2021).
* US. Dollar.
Concerning to AbbVie, it can be observed that it has had a growth of less than 2 per cent in revenues received for the year 2019 with a growth in its earnings that grew by 39 per cent. Sales are mainly attributed to what is called blockbuster drugs2, which generate at least a billion annually in sales. However, drugs such as Humira, which is used to treat rheumatoid arthritis, have lost their patent for Europe, which has not represented a problem for the company’s portfolio, which covers these losses with high-growth drugs used for cancer such as Imbruvica and Venclexta, as well as anti-inflammatory drugs such as Rinvoq. On the other hand, it is studying drug candidates for Parkinson’s, migraine, and myelofibrosis.
The company’s 49-year history of international recognition in which its dividends have shown a significant increase has allowed it to be placed within the S&P 500. Estimates of its dividend increase reached 128% in the last five years (Speights, 2021).
Bristol Myers Squibb, for its part, had revenues that rose 16 per cent in 2019, with profits standing at 30 per cent, mainly due to the acquisition-related to Celgene, a pharmaceutical that has also focused on cancer treatment. The company is in the work of fifty projects to obtain drugs for diseases such as sclerosis and blood cancer. Dividend increases have been experienced over the last twelve years and in the last five years have grown by 29 per cent.
Compared to the technology industry, the incremental financial returns of pharmaceutical companies are not as high. Despite this, the pharmaceutical companies listed above have a positive outlook, which is expected especially in the development of the COVID-19 vaccine, as well as in other projects.
The choice of pharmaceutical actions must be differentiated from biotechnological ones3. Pharmaceuticals use chemical products from which drugs are obtained. Biotechnology products, on the other hand, use living organisms to obtain the product. Both industries share possibilities for growth in their stock values. However, the biotechnology industry faces in many cases problems derived from the permission to use living organisms and situations related to the experimental process.
However, the investor needs to be aware of information related, for example, to the expiration of patents, increased competition in certain products, and the opening of the market for so-called generics. On the other hand, the so-called pipeline should be analyzed. At this point, it is of vital importance to analyze the current development phase of the drug in terms of its clinical trials and the approval and regulations of each country.
Companies include in their product portfolio products that are in the early stages of development that identify some drug candidates or are in preclinical testing. It is common to speak of three (3) phases for the effective development of a drug (Mahan, 2014):
TABLE 2. PHASES OF DEVELOPMENT OF DRUGS.
Phases |
Features of each pase |
Phase 0 |
Exploratory IND studies (also known as Phase 0 studies) are conducted at the beginning of clinical phase studies and involve limited human exposure and have no therapeutic or diagnostic intent. Doses are sub-therapeutic and patients are supervised by the clinical investigator. Generally, about ten (10) study patients participate. The duration of patient participation is usually less than one week. |
Phase 1 |
Small studies that are found to be drug candidates in which case they are trying to determine the effect on humans. According to Mahan, (2014): “A Phase I clinical trial evaluates the best way to administer a drug, its frequency and dose, the maximum tolerated dose (MTD), and side effects” (p. 1376). |
Phase 2 |
Studies that may include 100 or more patients and focus on determining safety, short-term side effects, and optimal drug dose. According to Mahan, (2014): “Phase I/II dose finding studies determine the most successful dose (MSD) which is the dose which maximizes the product of the probability of seeing no toxicity together with the probability of seeing a therapeutic response” (p. 1377). |
Phase 3 |
Larger studies may involve hundreds or even thousands of patients and focus on the efficacy of an experimental drug in treating a particular disease and its safety. |
Phase 4 |
Following FDA clearance, therapies deemed to be of proven safety, efficacy and quality may be made available to the general population. However, not all safety or efficacy issues have been verified. |
Phase 5 |
Phase five clinical trials refer to comparative effectiveness research and community-based research. Research is conducted based on the data collected. Patients are not followed up. Their primary objective is to determine the integration of a new therapy into widespread clinical practice. |
Source: Own construction based on Mahan, (2014).
Each of these is a condition that must be overcome to be able to enter the market without any limitations. Once the last phase has been completed, the pharmaceutical company will apply for the relevant regulations. It is estimated that the development of a drug is on average 2.6 billion dollars and its development take an average of ten (10) years until the time of approval. Despite this, there is a way to speed up the process through three options: breakthrough designation, orphan drug status, and priority review, in the case of U.S. regulation.
2. THEORETICAL BACKGROUND
There are several studies such as the one carried out by Grabowski and Vernon (1990), which analyzed the returns and risk in the pharmaceutical industry in the introduction of one hundred (100) drugs in the 1970s, compared to the 1980s. It appears that the 1980s meant a significant increase in the price of drugs. On the other hand, Munos and Chin (2011), propose a series of elements for the advancement of the industry that has to do with high-risk research by adopting models that involve collaborative innovation. Industry risks may relate to:
TABLE 3. RISKS IN PHARMACEUTICAL INDUSTRY.
Risks |
Features |
Risk 1 |
This is related to the clinical potential for failure and has to do with the possibility that drugs that are initial product candidates do not show efficacy in clinical trials. Some drugs ultimately fail to pass phase three. |
Risk 2 |
Another risk relates to the inability to obtain regulatory approval from regulatory agencies. |
Risk 3 |
Another risk is related to the difficulty of obtaining reimbursement, i.e., the ability of pharmaceutical companies to convince their customers, including government programs, to include their drugs in their treatments. Even the state can exert pressure to lower prices for certain drugs. |
Risk 4 |
The competition risk relates to the possibility of generic versions of a drug spreading or extending when patent exclusivity is lost. |
Source: Own construction.
Undoubtedly, the value of stock returns is difficult to predict. Volatility is an attribute of their behavior, especially in the short term. If we consider the pharmaceutical market to be efficient, what is meant by this is that the share price captures all possible information about stock performance, including the risk and expectations about it. The share price has an intrinsic value. However, other variables can be included, such as the price of competitors’ shares or the progress of certain drugs against the progress of competitors. Prices, according to Fama (1988), have a behavior through random walks. What this shows is that:
Where Pt is the neperian logarithm of the stock price in period t and at is the so-called white noise or a normal random variable with expectation, constant variance, and no autocorrelation. The best forecast that can be made of the stock for period t+1 conditional on what is known of the price up to t (Ωt), is the price t. Thus:
If there is a forecast error at+1, it is not autocorrelated with all public information in period t, which means semi-strong informational efficiency. If it is found to be uncorrelated with all types of information in t, then informational efficiency is strong. The lack of predictability of the variable determines the stock price from the following equation:
The unpredictability of affirms the idea of strong market performance. This indicates that any important future price information that may be known today is included in today’s price, thus preventing speculation. In the case of pharmaceuticals knowing today a breakthrough in a key drug today will allow that information to be included in today’s price to incorporate it into expectations.
Finally, the idea that prices incorporate information quickly does not imply price predictability. The contradiction between efficiency and predictability in the long term is complex.
Aravind and Manojkrishnan (2020), conducted a study focused on examining how COVID-19, affected pharmaceutical stocks listed in the Indian market, selecting ten (10) leading companies listed in the Indian NSE (National Stock Exchange of India) index. They started from the assumption that the stocks would move contrary to the general market trend. The data was collected through two time period splits pre-COVID-19 and post-COVID-19. A total of 123 daily stock value data were collected from the prices of the ten (10) companies from September 3th, 2019, to September 28th, 2020. The results showed a behavior in line with the trend of the stocks and the overall index (NIFTY-50)4 except one company which due to its strong reputation remained during the period of the downtrend in price.
The authors insist on the need to incorporate improvements at the technological level in the Indian market, without observing that in the resurgence of some diseases and this case of COVID-19, the shares tend to increase. Since there was no positive news in this aspect during the period, it is observed that the perception of an increase in stocks was not evidenced. When COVID-19 peaked in China, the effects on its Asian neighbor were evident, affecting its stock price negatively due to the dependence on its supply chains and essential components for products coming from the neighboring country. The NIFTY-50 calculation is based on the following equation:
Where p refers to the current and next stock prices and R the stock return.
Another paper by Sayema et al. (2005) focused on the estimation of betas coefficients for pharmaceutical companies in Bangladesh. The proposed analysis showed how the stock volatility of twenty-three (23) companies, sixteen (16) of which behave in line with the market trend. Some companies were defined as aggressive since they present a slight movement about the general market trend. They also found seasonality in several of the companies, through the use of the CAPM (Capital Asset Pricing Model), with the estimation of an econometric model that allowed the monitoring of the shares of the aforementioned companies over thirty-two (32) months. Companies such as Glaxo Smith and Kline had significant t-ratios. The limitations faced by the authors were related to the weight of the market, the observation of actual and not expected returns, and because the market portfolio should include all risky investments, only common stocks were included, however, the results are significant.
The study on pharmaceutical companies in Iran conducted by Kebriaee-zadeh et al. (2013), analyzes the profitability of stocks that were affected by financial ratios and other external economic variables. The method was supported by stock returns and considers that stocks are not directly related to the stock market. The researchers consider that in the analysis of twenty-two (22) pharmaceutical companies listed on the Tehran Stock Exchange through seven (7) years, as well as the factors involved in this behavior, through the proposal of a panel data econometric model and whose results show that 80% of the changes in the profitability of these stocks are explained through nine (9) fundamental variables:
FIGURE 1. FUNDAMENTAL VARIABLES OF EXPLANATION.
Source: Own construction. Based on Kebriaee-zadeh et al. (2013).
Iqbal Khan (2021), conducted a study of the corporate sector of Pakistan wherein the context of a high impact economic recession, the objective of the study was focused towards the proposal for improvement of dividend management decisions of the corporate sector. A sample of twenty-nine (29) companies listed on the KSE-1005 index was taken for the period 2001 - 2010. As for the results, through a random fixed effects methodology in panel data, the existing relationship between dividends and stock price is explained, establishing controls on other variables such as earnings per share, after-tax earnings, and return on equity.
The latter variables have a positive and significant relationship with share prices and allow us to establish a positive relationship between dividends and share prices, thus explaining the variations in the share prices of the pharmaceutical sector in Pakistan. Return on equity, on the other hand, has a negative influence on the share price. The idea of stating that dividends are irrelevant to stock prices does not apply in the case of Pakistan’s chemical and pharmaceutical industry.
Other results suggest that Pakistani investors in this sector prefer cash dividends and in the absence of cash in the flow of companies, they opt for stocks. For this reason, it is considered that dividends do show to be a consistent performance signal in the country’s chemical and pharmaceutical industry. All the variables in the model explain the stock price to a considerable extent. However, this study cannot be generalized to other countries because of the difference in the corporate structure.
Abdullah et al. (2020), focuses on the study of how infectious diseases affect stock market performance, also using such analysis the panel data study, for this cause harm the Chinese stock market. The results indicate that both the daily growth of total confirmed cases and total death cases caused by COVID-19 have significant negative effects on the stock returns of all companies.
Studies such as those of Qiao & Yan (2020), emphasize the change in the demand for financial goods in China in three (3) periods of analysis, pre-pandemic, during the pandemic, and post-pandemic, with financial instruments that have allowed progress in economic recovery in the context of a nation that has been identified as the origin of the outbreak. In the case of China, investment demand in the country suffered much more than consumer demand, especially in the initial stages of the outbreak. In periods of containment, investment in China could be controlled and the risk derived from the investment market remained stable.
Works such as that of Kola and Landis (2004), consider that the pharmaceutical industry faces important challenges related to the political role of the states, in a relationship between the control of drug costs and the budgets that can be managed at the health level in each of the countries. For example, in the case of the United States, the price of drugs is under public scrutiny through the FDA6 and the fiscal pressures surrounding the development of drugs and vaccines are becoming increasingly complicated and difficult to control, due to the very high investments that must be made in drug development through research and development budgets.
These studies offer a set of perspectives regarding the importance of the pharmaceutical market in the context of the financial market, mainly in Asian countries. This shows somewhat how these countries have advanced in perfecting the instruments to include the stock prices of pharmaceutical companies in the price stock. Advances in this process show how traditional pharmaceutical firms present returns in line with trends in their values and how others have managed to rise significantly. On the other hand, the population conditions of countries such as China, India, and Pakistan, provide a very wide market segment for the development of the consumption of pharmaceutical products.
Some methodological aspects related to data analysis are shown below.
3. DATA
3.1 The study period
The analysis of the behavior of the shares of the main pharmaceutical companies was taken from January 3, 2020, to February 2, 2021. In this period, the stock market price of the following pharmaceutical companies was taken: Pfizer, BioNTech, AstraZeneca, Moderna, Novavax, and Sanofi, who registered the value of their shares during 273 days, which for the case of the model to be analyzed will be considered as observations. On the other hand, Glaxo Smith and Kline’s share registry corresponded to 279 observations, which were listed on the stock exchange for six (6) more days. On the other hand, Johnson & Johnson reported a stock exchange listing of one more day, with 274 observations.
Finally, the German company CureVac reported only 117 trading days, from August 1, 2020, to January 2, 2021. On the other hand, the dates on which the main pharmaceutical companies reported significant progress in the achievement of vaccines for COVID-19 were identified, which allowed the construction of a dummy variable to identify the period in which significant progress was made in the vaccine and the periods in which it was in testing applications in the phases before its development7. The data was obtained from the portal and is based on the records that are obtained mainly in indices such as the NASDAQ. Below is a list of the dates on which various pharmaceutical companies have reported significant progress in vaccine development:
TABLE 4. REPORTED SIGNIFICANT PROGRESS IN VACCINE DEVELOPMENT.
Pharmaceutics |
Date |
Moderna |
The vaccine was reported to be obtained on November 16th, 2020. |
Pfizer |
The vaccine was reported to be obtained on November 9th, 2020. |
BioNTech |
The vaccine was reported to be obtained on November 9th, 2020. |
AstraZeneca |
The vaccine was reported to be obtained on November 19th, 2020. |
CureVac |
It has partnered with Bayern but is in phase three of the study. |
Sanofi |
Is partnered with GSK, but estimates vaccine release by the end of 2021. |
Novavax |
Reported stage three effectiveness of 89.3% on January 28th, 2021. |
Johnson & Johnson |
Reported January 29th 66% efficiency. |
Glaxo Smtih and Kline |
Is partnered with Sanofi, but estimates vaccine release by the end of 2021. |
Source: Own construction.
The behavior of the shares of pharmaceutical companies that have focused on the development of vaccines against COVID-19 shows large differences, mainly because the positive returns are concentrated in companies that began participating in the stock market relatively recently. On the other hand, traditional laboratories have had negative impacts on their share price.
Of the most important developers of the COVID-19 vaccine, returns have been concentrated in the companies BioNTech, Moderna, Novavax, and Curevac. These laboratories have been working in the pharmaceutical market for more than a decade, except Novavax, which was listed on the stock exchange only two years ago. The most important laboratories that have been listed for more than two decades and up to three decades are Pfizer, Sanofi, GSK-AstraZeneca, which had negative returns in 2020.
If we analyze the behavior of each of the companies, we observe that Pfizer had flat growth during 2020, with a significant drop at the end of March. For example, the drop in the shares concerning the last day of 2019 was 27.3 per cent, placing the average share price at $26.99. If there were improvements in December when there was speculation about vaccine advances with an average share price of $42.56. In 2019 the company’s revenue was down 4 per cent, but its earnings increased by 46 per cent. These increases may have been due to the relationship with GSK, through a joint venture. Pfizer currently has about thirty (30) working projects and an increase in dividends of 27 per cent over the last five years. Below, we observe the behavior of the share value in the defined period.
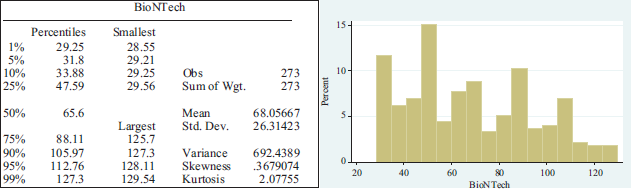
As can be seen, the share price had an average of $36.58817 and a standard deviation of $2.30372. BioNTech, on the other hand, recorded positive growth with an increase of up to 150 per cent by the end of 2020. On December 10, 2020, the share price reached $129.54, which is u increase of 282% over December 31, 2019. The company started its listing in October 2019 with substantial increases in its stock market value. If we analyze the subsequent behavior, we observe an increase in share value over time, with an average share value of 68.0567 and a standard deviation of 26.31423. The behavior of the shares is shown below:
On the other hand, the NASDAQ reports that Moderna has had a positive increase with a 470% increase for the year as a whole. The highest peak was located on December 8 which reached 768.4%, where the share value stood at $169.86 per share. Although the company also went public in 2018, it has had a year of growth and stability, despite a spread in share value 37.65702. The average share price for the period is $68.13978.
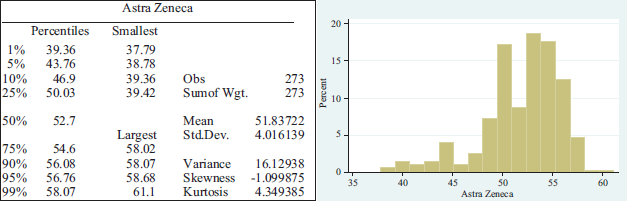
AstraZeneca, in its collaboration with Oxford University, recorded a 2.71 per cent decline in 2020. However, the share price has increased from the drop in March when it declined by 18.22 per cent. The average share price stood at $51.83722 per share and a standard deviation of $4.016139.
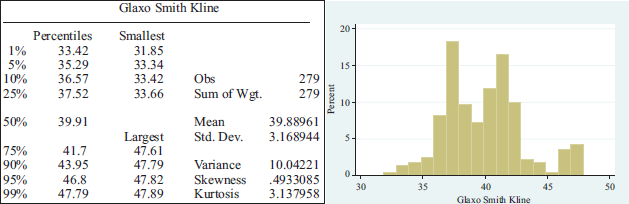
The pharmaceutical company Sanofi, presented a drop of 12 per cent, with an average share price of 49.26506 and a standard deviation of 2.648693 dollars, being one of those showing the least dispersion in the data. GSK on the other hand observed a decrease of almost 24 with an average share price of 39.88961 and a standard deviation of 3.168944.
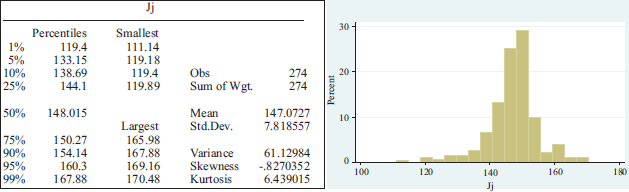
One of the most important laboratories, Johnson & Johnson, ended the year 2020 with a stock market increase of 6 per cent. Even in March, its share price rose 40 per cent. In general terms, its earnings and revenues did not suffer many changes, despite having suffered decreases in sales of its products related to baby care and immunological drugs such as Remicade. The company manages around forty development projects, including cancer and multiple sclerosis drugs such as Ponesimod. Its dividends increased by 35 per cent in the last five years and the average share price in the period under review is $147.0727 and a standard deviation of $7.818557.
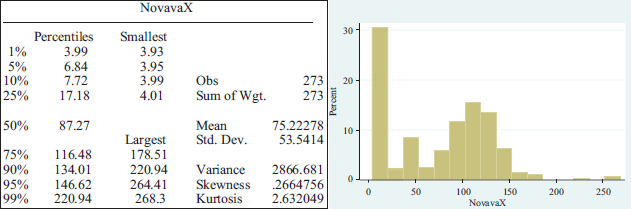
Novavax was one of the best performing pharmaceutical companies in 2020, with a stock market growth rate of 2.870 per cent. August saw the highest peak with an increase reaching 4.385 per cent with a share price of $178.51. The average share price is $75.22278 with a standard deviation of $53.5414.
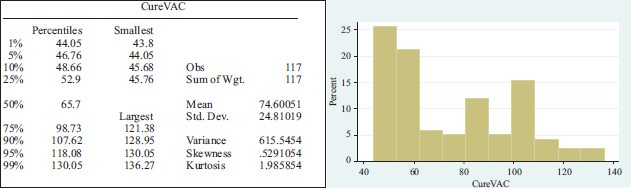
CureVac has been the best performing pharmaceutical company. After entering the stock market in August, the share price rose significantly, reaching a peak on December 9 with an increase of 6.92 per cent. The average share price was 74.60051 and a standard deviation of 24.81019 dollars. In the appendix 2, we observe the behavior of these shares.
3.2 Model Multiple Linear Regression MLR with variable dummy
The assumptions of the multiple regression model with dichotomous dummy variables must meet the same requirements for the case of data with quantitative variables so that it can be properly applied. Thus, the proper application of the point cloud of a straight line (linearity criterion), the equality of error variances (homoscedasticity), and the so-called normality must be corroborated (Dhrymes, 1994). On the other hand, it is important to highlight the independence of the scores as a prerequisite.
Thus, if we look at the graphical representation showing a characteristic in the case where X has only two values, i.e., two aligned and vertical series of points representing the dispersion of Y for each value of X, the line must constitute a good representation that seeks to unite both series, representing the changes in the behavior of one variable over the other.
The homoscedasticity criterion is met if the dispersion of the series of points concerning the predicted value within the premise X=0, is similar to the dispersion in the case of premise X=1. Compliance with homoscedasticity is related to the study of the errors. If these were plotted through a distribution of the function of the Y values, which are predicted, an approximation to the homoscedasticity test would be achieved. If graphical forms of this distribution are evidenced as a megaphone or inverted triangle, they can be considered as forms of a possible violation of the assumption.
On the other hand, if it is desired to test through a statistical test the fit of the data, the significance of the correlation between the absolute errors and the predicted Y values can be used. If a lack of significance of the correlation is found, homoscedasticity exists, without the procedure fully testing the non-compliance of the assumption. The last assumption of normality of the scores is considered if the distribution of points around each of the group means is found to fit a Gaussian bell distribution. The assumption is difficult to verify if there are little data. The matrix expression of the model is shown below:
So:
The next table shows the variables participants in the models:
TABLE 5. SUMMARY OF VARIABLES.
Share to be measured |
Variables to be used in the models. |
Coding |
Daily Share Price Pfizer. |
(DSPPfizt) |
U.S. dollars. |
Attribute COVID Pfizer. |
ACOVPfiz |
0= NO COVID 1= COVID |
Daily Share Price AstraZeneca. |
(DSPAstt) |
U.S. dollars. |
Attribute COVID AstraZeneca. |
ACOVAst |
0= NO COVID 1= COVID |
Daily Share Price BioNTech. |
(DSPBioNTt) |
U.S. dollars. |
Attribute COVID BioNTech. |
ACOVBioN |
0= NO COVID 1= COVID |
Daily Share Price Moderna. |
(DSPModt) |
U.S. dollars. |
Attribute COVID Moderna. |
ACOVMod |
0= NO COVID 1= COVID |
Daily Share Price Novavax. |
(DSPNOVt) |
U.S. dollars. |
Attribute COVID Novavax. |
ACOVNovavax |
0= NO COVID 1= COVID |
Daily Share Price Sanofi |
(DSPSanofit) |
U.S. dollars. |
Attribute COVID Sanofi. |
ACOVSanofi |
0= NO COVID 1= COVID |
Source: Own construction.
The variables in the model correspond to the daily market price of the shares of all the pharmaceutical companies: Pfizer, AstraZeneca, BioNTech, Moderna, Novavax, and Sanofi. The share price is expressed in US dollars. In addition to this set of variables, a dichotomous variable is included for each of the pharmaceutical companies described above, which include a value of 0 for the dates within the time series that did not yet present an advance in the vaccine and 1 for the dates of registration of market prices of their shares, where the vaccine was already found with a significant level of confidence to be marketed. Thus, there would be six (6) variables related to the price level and six (6) related to the dichotomous variable described above. Each model posits that the price level of a pharmaceutical company depends on the price level of its competition and its progress in achieving the vaccine in the time series.
When dichotomous variables are included in a model, the aim is to determine aspects related to the verification of an attribute in a sample or population, which is generally summarized as having or not having the attribute. In the proposed model, we can see that we want to verify, on the one hand, the effect that the stock price measured daily over some time has on each of the listed companies and, on the other hand, the impact that obtaining the vaccine against COVID-19 may have had. In this sense, the model can be specified as:
Where βXi is a quantitative variable that represents the share price of the other companies’ shares. D, called a dummy-variable regressor or an indicator variable, is coded 1 for pharmaceutics with vaccine COVID-19 and 0 pharmaceutics without vaccine COVID-19:
The following graph shows the behavior of the dichotomous variable:
FIGURE 2. THE ADDITIVE DUMMY-VARIABLE REGRESSION MODEL (A). THE ADDITIVE REGRESSION MODEL WITH TWO QUANTITATIVE EXPLANATORY VARIABLES X1 AND X2 REPRESENT PARALLEL PLANES WITH POTENTIALLY DIFFERENT INTERCEPTS IN THE {X1, X2, Y} SPACE (B).
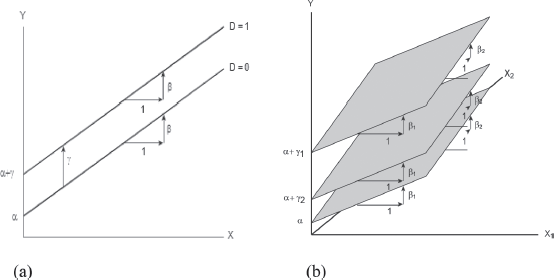
Source: Dhrymes (1994).
Thus, for pharmaceuticals without the development of a vaccine against COVID-19 the model becomes:
with vaccine COVID-19:
However, we can include not just one dichotomous variable, but several of them. Each of the pharmaceutical companies can have a variable that is associated with the presence or absence of the attribute. Thus, there can be a dichotomous variable for each of the pharmaceutical companies included in the observation. This variable is defined as the name of the pharmacist with the COV ending, which therefore acquires values of 0 and 1 in the series of observations depending on whether or not she obtained the COVID-19 vaccine. In that case, the date on which the vaccine breakthrough was reported will be taken into account and it is assumed that this announcement will have had an influence on prices not only in the company’s shares but also in those of other companies.
This exercise can be seen as an oversimplification of reality since it may be not only the value of the shares of the companies that represent the competition, but another set of possible variables, both exogenous and endogenous, which can have a level of influence on the prices of the shares of x or y pharmaceutical company. However, in the case of pharmaceutical companies, the products obey a strong insertion of added value, through the process of technological incorporation and especially in what has to do with the advance in pharmaceutical products such as vaccines.
In the same way, the discovery of the vaccine may have influenced the share price of a given pharmaceutical company. In this way, a linear regression model will also be analyzed for each of the proposed pharmaceutical companies, which meet the basic criteria of the model, in terms of the principles of linearity, which speaks about the relation between the predictors and the results must be linear; the principle of normality implies that the errors must be normally distributed.
Normality is required and different tests are defined for them. Multicollinearity can be defined as the relationship of strong linear dependence between more than two variables in a multiple regression that does not comply with the Gauss-Markov assumption when it is exact. This estimation of the coefficients must corroborate that the errors are identically and independently distributed. Likewise, it must be verified that the variance is homogeneous (homoscedasticity). The variance error must be constant. The independence of the errors associated with observation is not correlated with the errors of any observation.
In accordance with the results obtained, the Stata data analysis texts of Beniger and Robin (1978), Cox (2005), Harrison (2005) and correlation analysis mainly from the contributions of Pearson (1895) were used to support the interpretation of the results.
3.3. Results
Below is the set of models that have been run to show the relationship between different pharmaceutical companies, in the following order of independent variables: Pfizer share prices, AstraZeneca share prices, Moderna share prices, Novavax share prices, and lastly Sanofi share prices.
TABLE 6. SUMMARY MODEL PFIZER.
Variable |
β and γ8 |
T |
P > t |
Intercept |
Daily Share Price AstraZeneca (DSPAstt) |
0.249474 |
4.44 |
0.0000 |
11.45331 |
Daily Share Price BioNTech (DSPBioNt) |
0.037892 |
4.95 |
0.0000 |
|
Daily Share Price Novavax (DSPNOVt) |
–0.019318 |
–4.63 |
0.0003 |
|
Daily Share Price Sanofi (DSPSanofit) |
0.225453 |
2.98 |
0.0000 |
|
N |
273 |
273 |
|
|
F (4, 268) |
38.96* |
|
|
|
R-squared |
0.3677 |
|
|
|
Adj R-squared |
0.3582 |
|
|
|
Root MSE |
1.8455 |
|
|
|
Note: a) *< 0.05. b) The model was estimated by the Ordinary Least Squares method. b) Source: Own construction.
The results of the model are as follows:
The R is relatively low at only 0.3677 and r-adjusted of 0.3582. Next, we found that the model’s compliance conditions in terms of multicollinearity, -through tolerance factors and variance inflation-, homoscedasticity -through the Breusch-Pagan and Godfrey test9- and the normal distribution of the errors, meet the criteria for linear regression.
TABLE 7. MULTICOLLLINEARITY, BREUSCH-PAGAN-GODFREY AND NDE10 TEST PFIZER.
Multicollinearity Tolerance Factors and Variance Inflation. |
Homocedasticity Breusch-Pagan-Godfrey. |
Normally distributed error. |
|
AstraZeneca |
4.06 |
Prob>chi2= 0.3164 |
Error 0.4318 |
Novavax |
3.99 |
||
Sanofi |
3.21 | ||
BioNTech |
3.17 |
||
10 Normally distributed error.
Source: Own construction.
The following model focused on establishing the influence on pharmaceutical stock price and vaccine manufacturing progress on AstraZeneca’s stock value.
TABLE 8. SUMMARY MODEL ASTRAZENECA.
Variable |
β and γ |
T |
P > t |
Intercept |
Daily Share Price Pfizer (DSPPfizt) |
0.258055 |
4.43 |
0.0000 |
–3.312144 |
Daily Share Price Novavax (DSPNOVt) |
0.027684 |
10.81 |
0.0000 |
|
Attribute COVID Novavax (ACOVNovavax) |
–3.283756 |
–3.12 |
0.0002 |
|
Daily Share Price Sanofi (DSPSanofit) |
0.8864954 |
16.37 |
0.0000 |
|
N |
273 |
273 |
|
|
F (4, 268) |
235.26* |
|
|
|
R-squared |
0.7783 |
|
|
|
Adj R-squared |
0.7750 |
|
|
|
Root MSE |
1.9049 |
|
|
|
Note: a) *< 0.05. b) The model was estimated by the Ordinary Least Squares method. b) Source: Own construction.
In this sense, the model is specified as follows:
The results of the model are as follows:
The model’s sling fit value is much higher than in the case of Pfizer with R of 0.7783 and r-adjusted of 0.7750. The model indicates that the value of Sanofi shares has a greater impact on the price of AstraZeneca and that the influence of the development of the Novavax vaccine, despite the few days in which the dummy variable takes attribute presence values, show a negative impact of -3.283756. That is, the development of the Novavax vaccine could influence a decrease in AstraZeneca’s share price.
TABLE 9. MULTICOLLLINEARITY, BREUSCH-PAGAN-GODFREY AND NDE TEST ASTRAZENECA.
Multicollinearity Tolerance Factors and Variance Inflation. |
Homocedasticity Breusch-Pagan-Godfrey. |
Normally distributed error. |
|
Pfizer |
1.35 |
Prob>chi2= 0.0049 |
Error 0.4318 |
Novavax |
1.41 |
||
NovavaxCOV |
1.20 | ||
Sanofi |
1.54 |
||
Source: Own construction.
It is observed that the regression model complies with the multicollinearity conditions, but there are problems in the Breusch-Pagan and Godfrey homoscedasticity test with a value of 0.0049 below 5 per cent. As for the distribution of the errors, a value of 0.4318 is observed.
TABLE 10. SUMMARY MODEL MODERNA.
Variable |
β and γ |
T |
P > t |
Intercept |
Daily Share Price Pfizer (DSPPfiz) |
1.610935 |
3.34 |
0.0000 |
–23.39463 |
Daily Share Price BioNTech (DSPBioN) |
1.02173 |
15.52 |
0.0000 |
|
Daily Share Price Novavax (DSPNOV) |
0.1336743 |
3.73 |
|
|
Attribute COVID Novavax (ACOVNovavax) |
27.18987 |
3.20 |
0.0000 |
|
Daily Share Price Sanofi (DSPSanofi) |
–0.9620614 |
–2.03 |
0.0043 |
|
N |
273 |
273 |
|
|
F (4, 268) |
284.34* |
|
|
|
R-squared |
0.8419 |
|
|
|
Adj R-squared |
0.8389 |
|
|
|
Root MSE |
15.113 |
|
|
|
Note: a) *< 0.05. b) The model was estimated by the Ordinary Least Squares method. b) Source: Own construction.
The results of the model are as follows:
For the R we found that it is superior to the models related to Pfizer and AstraZeneca with a value of 0.8419 and an adjusted r of 0.8389. Regarding the most influential variables, we find that the dichotomous variable related to the advances in the development of the vaccine by Novavax has a greater impact on the share price of Moderna with a value of 27.18987, followed by the share price of Pfizer and the share price of BioNTech, with a coefficient of 1.02173. A proportional relationship in terms of price influence between both vaccine development companies. According with multicollinearity, homoscedasticity, and normal error distribution we have for this model:
TABLE 11. MULTICOLLLINEARITY, BREUSCH-PAGAN-GODFREY AND NDE TEST MODERNA.
Multicollinearity Tolerance Factors and Variance Inflation. |
Homocedasticity Breusch-Pagan-Godfrey. |
Normally distributed error. |
|
Pfizer |
1.47 |
Prob>chi2= 0.0000 |
Error 0.4318 |
BioNTech |
3.57 |
||
Novavax |
1.24 |
||
NovavaxCOV |
1.47 |
||
Sanofi |
1.87 |
||
Source: Own construction.
It is observed that the regression model complies with the multicollinearity conditions, but there are problems in the Breusch-Pagan and Godfrey homoscedasticity test with a value of 0.0000 less than 5 per cent. As for the distribution of the errors, a value of 0.4318 is observed.
Concerning the influence of the variables included in the model and the prices of Novavax pharmaceuticals, we found a relationship with the prices of Pfizer, AstraZeneca, BioNTech, Moderna, and Sanofi. Similarly, there is evidence of an influence on the vaccine advances of BioNTech and Novavax pharmaceuticals. Below are the results:
TABLE 12. SUMMARY MODEL NOVAVAX.
Variable |
β and γ |
T |
P > t |
Intercept |
Daily Share Price Pfizer (DSPPfiz) |
–2.442387 |
–3.33 |
0.001 |
–212.6357 |
Daily Share Price AstraZeneca (DSPAstt) |
2.033351 |
2.64 |
0.009 |
|
Daily Share Price BioNTech (DSPBioNt) |
1.079931 |
9.06 |
0.000 |
|
Attribute COVID BioNTech (ACOVBioN) |
–43.4427 |
–6.30 |
0.000 |
|
Daily Share Price Moderna (DSPModt) |
0.6828679 |
6.19 |
0.000 |
|
Attribute COVID Novavax (ACOVNovavax) |
73.50764 |
6.13 |
0.000 |
|
Daily Share Price Sanofi (DSPSanofi) |
3.246588 |
3.47 |
0.000 |
|
N |
273 |
273 |
|
|
F (7, 265) |
195.22* |
|
|
|
R-squared |
0.8376 |
|
|
|
Adj R-squared |
0.8333 |
|
|
|
Root MSE |
21.861 |
|
|
|
Note: a) *< 0.05. b) The model was estimated by the Ordinary Least Squares method. b) Source: Own construction.
The model for Novavax is shown below:
The results of the model are:
For the R we found that it is a value of 0.8376 and an adjusted r of 0.8333. Regarding the most influential variables, we find that the dichotomous variable related to the advances in the development of the vaccine by BioNtech with a value of -43.4427, followed by advances in Novavax vaccine with a value of 73.50764. Concerning with the share price of Pfizer and the value is negative -2.442387 and positive values with Sanofi (3.246588); AtraZeneca (2.033351). The share price of BioNTech, with a coefficient of 1.079931 is a proportional relationship in terms of price influence between both vaccine development companies. According with multicollinearity, homoscedasticity, and normal error distribution we have for this model:
TABLE 13. MULTICOLLLINEARITY, BREUSCH-PAGAN-GODFREY AND NDE TEST NOVAVAX.
Multicollinearity Tolerance Factors and Variance Inflation |
Homocedasticity Breusch-Pagan-Godfrey |
Normally distributed error |
|
Pfizer |
1.63 |
Prob>chi2= 0.0000 |
Error 0.4318 |
AstraZeneca |
5.43 |
||
BioNTech |
5.60 |
||
BionTechCOV |
4.54 |
||
Moderna |
9.83 | ||
NovavaxCOV |
1.18 |
||
Sanofi |
3.50 |
||
Source: Own construction.
It is observed that the regression model has a high value for the share prices of AstraZeneca, BioNTech and very high for the share price of Moderna, due to the fact that they are higher than 5. There are problems in the Breusch-Pagan and Godfrey homoscedasticity test with a value of 0.0000 below 5 per cent. As for the distribution of the errors, a value of 0.4318 is observed.
Finally, analyzed the pharmaceutical Sanofi.
TABLE 14. SUMMARY MODEL SANOFI.
Variable |
β and γ |
T |
P > t |
Intercept |
Daily Share Price AstraZeneca (DSPAstt) |
0.7096125 |
23.45 |
0.000 |
15.72922 |
Attribute COVID AstraZeneca (ACOVAst) |
3.928012 |
7.84 |
0.000 |
|
Daily Share Price Moderna (DSPModt) |
–0.0633212 |
–9.17 |
0.000 |
|
Daily Share Price Novavax (DSPNovt) |
0.0094289 |
3.14 |
0.002 |
|
N |
273 |
273 |
|
|
F (7, 268) |
201.09* |
|
|
|
R-squared |
0.7501 |
|
|
|
Adj R-squared |
0.7464 |
|
|
|
Root MSE |
1.334 |
|
|
|
Note: a) *< 0.05. b) The model was estimated by the Ordinary Least Squares method. b) Source: Own construction.
The model for Sanofi is shown below:
The results of the model are:
For the R we found that it is a value of 0.7501 and an adjusted r of 0.7464. Regarding the most influential variables, we find that the dichotomous variable related to the advances in the development of the vaccine by AstraZeneca with a value of 3.928012, followed the share price of AtraZeneca with the value 0.7096125. The share price of Moderna presents a negative coefficient of -0.033212. Exists a low relationship in terms of price influence between share prices of Sanofi and Novavax with a value 0.0094289. According with multicollinearity, homoscedasticity, and normal error distribution we have for this model:
TABLE 15. MULTICOLLLINEARITY, BREUSCH-PAGAN-GODFREY AND NDE TEST SANOFI.
Multicollinearity Tolerance Factors and Variance Inflation. |
Homocedasticity Breusch-Pagan-Godfrey. |
Normally distributed error. |
|
Moderna |
10.33 |
Prob>chi2= 0.0236 |
Error 0.4318 |
AstraZenecaCOV |
5.76 |
||
Novavax |
3.96 |
||
AstraZeneca |
2.21 |
||
Source: Own consruction.
It is observed that the regression model Moderna and AstraZenecaCOV have Multicollinearity Tolerance Factors and Variance Inflation of 10.33 and 5.76 with Breusch-Pagan and Godfrey homoscedasticity test with a value of 0.0236 less than 5 per cent. As for the distribution of the errors, a value of 0.4318 is observed. Next, we find the correlation matrix.
Significant associations are found between Pfizer vaccine breakthrough and AstraZeneca vaccine breakthrough variables with 0.9117; between BioNTech and AstraZeneca vaccine breakthrough with a coefficient also of 0.9117. We can also find a significant association between Moderna share prices and Pfizer vaccine breakthrough with 0.8108. Between Moderna share price and BioNTech share price, with a coefficient of 0.903. Similarly, a strong association is found between the advance in Moderna’s vaccine and the advance in Pfizer’s vaccine with 0.945; between the advance in Moderna’s vaccine and the advance in AstraZeneca’s vaccine with 0.9647, and another strong association between the advance in Moderna’s vaccine and the advance in BioNTech’s vaccine with a coefficient of 0.945. Sanofi, meanwhile, has a strong association between its share price and AstraZeneca’s share price. Below is the matrix graph for each of the pharmaceuticals:
Large dispersions are observed between Pfizer and Moderna, between AstraZeneca and BioNTech, and larger concentrations between Pfizer and Sanofi, Sanofi, and AstraZeneca. In some cases, such as the relationship between Pfizer and BioNTech, as well as Pfizer and Moderna and Pfizer and Novavax, AstraZeneca and BioNTech, AstraZeneca and Moderna or AstraZeneca and Novavax, it can be deduced that a linear relationship is difficult, due to data dispersion.
TABLE 16. SUMMARY CORRELATIONS MATRIX.
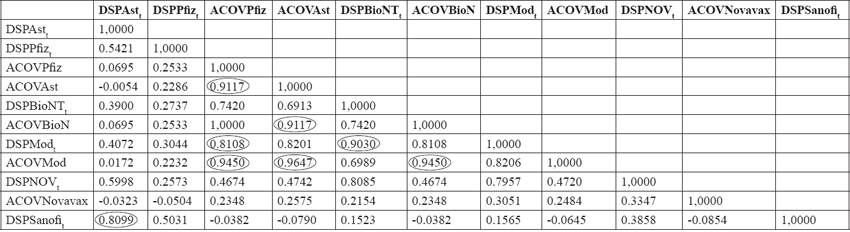
Source: Own construction.
FIGURE 3. GRAPH CORRELATION MATRIX.
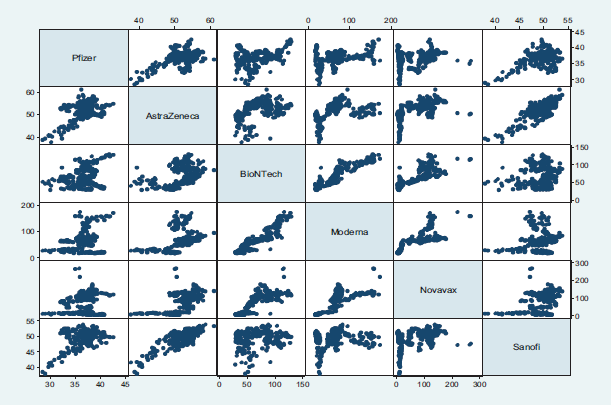
Source: Own construction.
4. SUMMARY AND CONCLUSIONS
The analysis of the share prices of the main pharmaceutical companies dedicated to the development of the vaccine against COVID-19 show in the models analyzed an important influence of the competitor’s share price and the progress in the achievement of the vaccine, which, as we have seen, was operationalized through a dummy variable. The correlation matrix shows at least six (6) relationships with correlation coefficients, mainly Pearson’s, higher than 90. Although neither a cause-effect nor a dependence relationship can be established, it is possible to speak of a strong association between the progress in obtaining the Pfizer-Moderna vaccine, Moderna-BioNTech, and significantly high between Moderna-AstraZeneca.
The proposed models with better goodness of fit expressed with R, are found in the companies of Moderna, Astrazeneca, Novavax, and Sanofi, without exceeding 90 per cent, with a low level of fit for Pfizer. Novavax is the company that adjusted with the highest number of explanatory variables (7), while the other models show the influence of four (4) significant variables. For Pfizer’s prices, it is not significant that the other companies develop the vaccines, while the value of the shares of four (4) of the competing companies has a greater influence with positive betas. The case of AstraZeneca is different since there is a positive influence on the development of the vaccine by Novavax.
The competition among pharmaceutical companies in the COVID-19 situation has generated a global recognition of the activities of the pharmaceutical companies, which does not leave out the analysis of the economic returns already traditionally perceived and recognized as of special interest, since the pandemic implies an urgent and generalized development of vaccines for the treatment of this disease. However, some of these companies have presented significant shocks in the price of their shares and it has been through the development of vaccines against this disease that they have managed to generate processes of equilibrium and stabilization of their prices.
It is considered that the exposed models can serve as an indicator so that pharmaceutical companies and investors in the pharmaceutical market can have some elements of prospective analysis when making a purchase decision in a macro and scenario such as the COVID-19 pandemic. It is important to recognize that companies in any type of market are mobilized based on the value of their assets and the reference prices of their competitors, not only in terms of the products generated but also in the value of their shares. On the other hand, the over-simplified model reports on the impact on the progress in the procurement of pharmaceutical products, in this case, vaccines, on the generation of value for the company that generates these products and its new situation in the market.
BIBLIOGRAPHICAL REFERENCES
ABDULLAH M. et al. (2020). “Death and contagious infectious diseases: Impact of the COVID-19 virus on stock market returns”. Journal of Behavioral and Experimental Finance, Volume 27, pp. https://doi.org/10.1016/j.jbef.2020.100326.
ARAVIND, M. AND MANOJKRISHNAN, C.G. (2020). “COVID 19: Effect on leading pharmaceutical stocks listed with NSE”. International Journal of Research in Pharmaceutical Sciences. 11(SPL) (1): 31–36.
BENIGER, J. R., AND D. L. ROBYN. (1978). Quantitative graphics in statistics: A brief history. American Statistician 32.
COX, N. J. (2005). Speaking Stata: Density probability plots. Stata Journal 5: 259–273. 1–11.
DHRYMES, P. (1994). Topics in Advanced Econometrics. Volume II. Linear and Nonlinear Simultaneous Equations. Springer-Verlag.
FAMA, E.F. AND FRENCH, K.R. (1988). "Permanent and Temporary Components of Stocks prices". Journal of Political Economy, 96:246–273.
GRABOWSKI, H AND VERNON, J (1990). “A New Look at the Returns and Risks to Pharmaceutical R&D”. Management Science, vol 36, 7, 767–885. https://doi.org/10.1287/mnsc.36.7.804
HALUNGA, A, ORME, C AND YAMAGATA, T (2017). “A Heteroskedasticity Robust Breusch-Pagan Test for Contemporaneous Correlation in Dynamic Panel Data Models”. Journal of Econometrics. pp. 209–230. https://doi.org/10.1016/j.jeconom.2016.12.005
HARRISON, D. A. (2005). Stata tip 20: Generating histogram bin variables. Stata Journal 5: 280–281.
IQBAL KHAN, K. (2012). “Effect of Dividends on Stock Prices– A Case of Chemical and Pharmaceutical Industry of Pakistan”. Management, 2(5): 141–148. https://doi.org/10.5923/j.mm.20120205.02
KAUSHIK, M. et al. (2005). “Statistical Properties of Business Firms Structure and Growth”. arXiv:physics/0502081 [physics.soc-ph]
KEBRIAEE-ZADEH, A. et al. (2013). “Fundamentals and Stock Return in Pharmaceutical Companies: a Panel Data Model of Iranian Industry”. Iranian Journal of Pharmaceutical Sciences 9 (1). pp. 55–60.
KOLA, I, AND LANDIS, J. (2004). “Can the pharmaceutical industry reduce attrition rates?” Nat Rev Drug Discov 3, pp. 711–716. https://doi.org/10.1038/nrd1470
MAHAN, V. L. (2014). “Clinical Trial Phases”. International Journal of Clinical Medicine, 5, 1374–1383. http://dx.doi.org/10.4236/ijcm.2014.521175
MUNOS, B. H. CHIN, W. W. (2011). “How to Revive Breakthrough Innovation in the Pharmaceutical Industry”. Sci. Transl. Med. 3, 89–116. DOI: 10.1126/scitranslmed.3002273
PEARSON, K. (1895). Contributions to the mathematical theory of evolution—II. Skew variation in homogeneous material. Philosophical Transactions of the Royal Society of London, Series A 186: 343–414.
QIOA, F, AND YAN, Y (2020). “How does stock market reflect the change in economic demand? A study on the industry-specific volatility spillover networks of China’s stock market during the outbreak of COVID-19”. arXiv:2007.07487v1 [q-fin.GN]
SAYEMA, H. et al. (2005). “How Volatile are the Stocks of the Pharmaceutical Companies of Bangladesh? Some Evidences from the Market Model”. Bank Parikrama, vol. XXX, No. 2, Bangladesh Institute of Bank Management, pp 1–23. DOI: 10.2139/ssrn.1550561
SORNETTE, D. (2000). “Economy of Scales in R&D with Block-busters”. arXiv:cond-mat/0001434 31
SCOTT, D, SAINI, A, AND ZAMAN, T. (2018) “Picking Winners: A Data Driven Approach to Evaluating the Quality of Startup Companies”. arXiv:1706.04229v2 [stat.AP] 8 Jul 2018
SPEIGHTS, K (2021). Investing in pharmaceutical Stocks. Recovered: https://www.fool.com/investing/stock-market/market-sectors/healthcare/pharmaceutical-stocks/
APPENDIX 1
Summary statistics per pharmaceutical lab.


APPENDIX 2
The stock performance of pharmaceutical companies: Pfizer, BioNTech, Novavax, AstraZeneca, Moderna, Sanofi, GSK, Johnson and Johnson and Curevac.

_______________________________
* Email: davera01@yahoo.com
** Email: favalencia@sena.edu.co
Fecha de envío: 27/09/2021. Fecha de aceptación: 04/12/2021.
1 Kaushik et. al (2005), has proposed a study of pharmaceutical sales of more than 55624 products with a total of 3939 firms in a period between 1992-2001. From a theoretical point of view, if one could have a firm i with sales Si with Ni products which are ξi,j where j=1, 2,…, Ni. The size of the firm in terms of its sales can be expressed through the products offered . And the growth rate would be given by:
Where:
Si(t)= sales.
Si(t+Δt)= these are the sales in subsequent periods. In the case of the investigation cited is given in British pounds.
t= year of reference.
The values were carried out through a function PDF (Probability Density Function).
2 Sornette (2000), for his part, raises the question of economies of scale about whether programs with a large number of projects or those with few projects are more efficient from the production point of view. This question is relevant to the incursion into new drugs. The phenomenon of blockbusters, which represent sales of top products that generate a much larger flow than the rest of the products, has been analyzed in the pharmaceutical sector. If we denote the cumulative discounted sales of pharmaceutical innovation as S, we have that the distribution of sales can be parameterized by the power law:
Where:
P(S) dS= probability that an innovation will result in sales between S y S+dS.
Smin = minimum value such that the distribution disappears below Smin.
α = exponent controlling the frequency of large sales.
If it is observed that the distribution s=SC, where C, corresponds to the fixed costs of production and marketing that are subtracted from sales, the so-called quasi-rents are obtained. On a log-log scale, the value of s would be given by:
3 A study that shows the behavior of emerging companies, -within which the biotechnology sector is back-, using a portfolio that is theoretically supported by data that move randomly from a Bayesian and Brownian motion stance can be observed in Scott, Saini, and Zaman (2018). The generated model can allow being a basis for pharmaceutical companies’ choice of products or goods to provide.
4 Benchmark index of the Indian Stock Exchange.
5 It is a stock market index that acts as a benchmark to compare prices over a period on the Karachi Stock Exchange in Pakistan.
6 The FDA (Food and Drug Administration) is the entity in charge of evaluating drugs in the United States, while the EMA (European Medicines Agency) is responsible in Europe.
7 The data was obtained from the portal https://www.investing.com/; and is based on records obtained mainly from indexes such as NASDAQ.
8 β refers to the coefficients of the stock price level and γ to the progress in the generation of the COVID vaccine.
9 An excellent text about the relevance of the Breusch-Pagan-Godfrey is Halunga, Andreea, Orme, Chris and Yamagata, Takashi (2017). “A Heteroskedasticity Robust Breusch-Pagan Test for Contemporaneous Correlation in Dynamic Panel Data Models”. Journal of Econometrics. pp. 209-230. https://doi.org/10.1016/j.jeconom.2016.12.005