Miscelánea
water and landscape
AGUA y TERRITORIO
Processing of heterogeneous data on the state of centralized water supply using geoinformation technologies
Procesamiento de datos heterogéneos sobre el estado del abastecimiento centralizado de agua mediante tecnologías de geoinformación
Roman V. Romanov
Vladimir State University named after
Alexander and Nikolay Stoletovs
Vladimir, Rusia
romanov.roman.5@yandex.ru
 ORCID: 0000-0003-2280-3771
Article information
Recibido: 19/02/2024
Revisado: 19/02/2025
Aceptado: 03/03/2025
Online: 30/09/2025
Publicado: 10/01/2026
ISSN 2340-8472
ISSNe 2340-7743
 CC-BY
CC-BY
Universidad de Jaén (España)
ABSTRACT
With the growth of the urban population, new pipelines of different ages, materials and sizes are being added to the existing network, thereby complicating the task of monitoring operation and maintenance. There are constant leaks of extracted and transported water through worn-out plumbing. The purpose of this work is to consider and apply tools for obtaining and processing heterogeneous data obtained at key measuring points of the centralized water supply network, to develop analytical software that allows integrating the data obtained with existing GIS systems. The scientific novelty lies in the fact that on the basis of the existing methodology for assessing water quality in the water supply system, the author’s methodology was developed and optimized for the task of integral assessment of water quality, a parametric model of the technical condition of centralized water supply was applied. The results of leak detection on the water supply network are presented.
KEYWORDS: Centralized water supply system, Hydrodynamic model, Analytical support, GIS technologies.
RESUMEN
Con el crecimiento de la población urbana, a la red existente se suman nuevas tuberías de diferentes edades, materiales y tamaños, lo que complica la tarea de monitoreo de operación y mantenimiento. Hay constantes fugas de agua extraída y transportada a través de tuberías desgastadas. El propósito de este trabajo es considerar y aplicar herramientas para la obtención y procesamiento de datos heterogéneos obtenidos en puntos de medición clave de la red de suministro de agua centralizada, para desarrollar un software analítico que permita integrar los datos obtenidos con los sistemas GIS existentes. La novedad científica radica en el hecho de que, sobre la base de la metodología existente para evaluar la calidad del agua en el sistema de suministro de agua, se desarrolló y optimizó la metodología del autor para la tarea de evaluación integral de la calidad del agua, se aplicó un modelo paramétrico del estado técnico del suministro de agua centralizado. Se presentan los resultados de la detección de fugas en la red de suministro de agua.
PALABRAS CLAVE: Sistema centralizado de abastecimiento de agua, Modelo hidrodinámico, Soporte analítico, Tecnologías SIG.
Processamento de dados heterogêneos sobre o estado da água centralizada usando tecnologias de geoinformação
RESUMO
À medida que a população urbana cresce, novos oleodutos de diferentes idades, materiais e tamanhos são adicionados à rede existente, dificultando assim a tarefa de monitorar a operação e a manutenção. Há vazamentos constantes de água extraída e transportada através de um encanamento desgastado. O objetivo deste trabalho é analisar e aplicar ferramentas para a obtenção e processamento de dados heterogêneos obtidos em pontos-chave de medição da rede de abastecimento de água centralizada, desenvolvendo um suporte analítico que permita integrar os dados obtidos com os sistemas de Informação Geográfica existentes. A novidade científica reside no fato de que, com base na metodologia existente para avaliar a qualidade da água no sistema de abastecimento de água, foi desenvolvida a metodologia do autor e otimizada para a tarefa de avaliação integral da qualidade da água, foi aplicado um modelo paramétrico do estado técnico do abastecimento de água centralizado. Os resultados da detecção de vazamentos na rede de abastecimento de água.
PALAVRAS-CHAVE: Sistema centralizado de abastecimento de água, Modelo hidrodinâmico, Suporte analítico, Tecnologias GIS.
Traitement de données hétérogènes sur l’état de l’approvisionnement en eau centralisé à l’aide de technologies de géoinformation
RÉSUMÉ
Avec la croissance de la population urbaine, de nouveaux pipelines d’âges, de matériaux et de tailles différents sont ajoutés au réseau existant, compliquant ainsi la tâche de surveillance de l’exploitation et de la maintenance. Il y a des fuites constantes d’eau extraite et transportée par des conduites d’eau usées. Le but de ce travail est d & apos; examiner et d & apos; utiliser des outils permettant d & apos; obtenir et de traiter des données hétérogènes obtenues aux points de mesure clés du réseau d & apos; approvisionnement en eau centralisé, et de mettre au point un outil analytique permettant d & apos; intégrer les données obtenues aux systèmes d & apos; information géographique existants. La nouveauté scientifique réside dans le fait que, sur la base de la méthode existante d’évaluation de la qualité de l’eau dans le système d’approvisionnement en eau, la méthode de l’auteur a été développée et optimisée pour la tâche d’évaluation intégrale de la qualité de l’eau, le modèle paramétrique de l’état technique de l’approvisionnement en eau centralisé a été appliqué. Voici les résultats de la détection de fuites sur le réseau d’eau.
MOTS-CLÉ: Système d’approvisionnement en eau centralize, Modèle hydrodynamique, Support analytique, Technologies GIS.
Elaborazione di dati eterogenei sullo stato dell’approvvigionamento idrico centralizzato utilizzando tecnologie di geoinformazione
SOMMARIO
Con la crescita della popolazione urbana, nuove condutture di diverse età, materiali e dimensioni vengono aggiunte alla rete esistente, complicando così il compito di monitorare il funzionamento e la manutenzione. Ci sono perdite costanti di acqua estratta e trasportata attraverso una rete idrica usurata. Lo scopo di questo lavoro è quello di esaminare e applicare strumenti per ottenere ed elaborare dati eterogenei ottenuti nei punti di misurazione chiave della rete di approvvigionamento idrico centralizzato, sviluppando un supporto analitico che consenta l’integrazione dei dati ottenuti con i Sistemi Informativi Geografici esistenti. La novità scientifica sta nel fatto che sulla base della metodologia esistente per valutare la qualità dell’acqua nel sistema di approvvigionamento idrico, è stata sviluppata la tecnica dell’autore e ottimizzata per il compito di valutare integralmente la qualità dell’acqua, è stato applicato un modello parametrico dello stato tecnico dell’approvvigionamento idrico centralizzato. Sono riportati i risultati del rilevamento di perdite sulla rete idrica.
PAROLE CHIAVE: Sistema di approvvigionamento idrico centralizzato, Modello idrodinamico, Supporto analitico, Tecnologie GIS.
Introduction
In developed countries, the regulation of drinking water quality remains the most important area of health protection and improvement of the quality of life of the population1. In accordance with the Sustainable Development Goals, universal and equitable access to safe and affordable drinking water should be ensured for all the world’s population by 20302. Half a billion people in the world face acute water scarcity all year round3. The main factors in the growth of global demand for water are: the growth of the world’s population, an increase in life expectancy, an improvement in the quality of life, and a change in water consumption habits4. According to the 2018 revision of the prospects for global urbanization, 68 % of the world’s population will live in urban areas by 2050. Currently, 55 % of the world’s population lives in urban areas. According to data published by the United Nations, almost 73.3 % of the population of the Russian Federation will live in cities and urban areas5.
However, the water supply networks in many cities and towns are in a worn-out condition. With the growth of the urban population, new pipelines of different ages, materials and sizes are being added to the existing network, thereby complicating the task of monitoring operation and maintenance6. In this regard, there are constant leaks of extracted and transported water through worn-out water pipes. Water losses in water supply networks reach up to 65 % due to leaks associated with natural aging of pipes, earthquakes, illegal connection, poor quality of pipe material, temperature and pressure, geological changes and human damage, etc.7.
Also, due to the high wear of pipes and the formation of through holes, the quality of water delivered to end users sharply deteriorates in them. Reducing losses from leaks and identifying worn-out sections of the water supply network is an important measure to reduce both the economic costs of enterprises transporting water and to provide the population with high-quality water8. Currently, a lot of data has been accumulated on the impact of drinking water quality, especially its chemical composition, on public health, and the water quality index (WQI) has been developed9.
Real-time monitoring and data collection are crucial for building reliable and practical information systems. In addition, to build models, the data must be accurate and detailed10. There are a number of technical solutions aimed at detecting leaks11. New approaches to risk assessment using algorithms or models in stationary or transient conditions have been proposed12. With the development of digital technologies, online monitoring has begun to be used, which allows collecting data on water flow and pressure in almost real time13. After calibration and optimization, the water supply system is continuously monitored using a risk assessment algorithm, a computer system, which makes the maintenance of the network model very efficient14.
The risk assessment of municipal pipeline networks focuses on the qualitative and quantitative analysis of the consequences of accidents. However, in order to quickly identify problematic areas of the centralized water supply system, it is necessary to identify key measuring points where the quality control of the centralized water supply will be carried out. At the selected points, it is necessary to monitor the indicators on the basis of which it will be possible to determine the condition of pipe wear. During measurements on the water supply network, data such as curves of the characteristics of pumping units, water consumption on the network, consumer water consumption, water levels in reservoirs, etc. should be obtained. Information about the current state of the network and the characteristics of the elements of the water supply system can be obtained on the basis of defective statements, executive documentation, equipment passports.
The second important issue is the systematization and evaluation of the data obtained at key points. Geoinformation technologies are well suited for this, which will allow analyzing large amounts of data, automating the assessment process, calculating integral and average annual indicators, and mapping the results obtained15. Passing a fairly long way through the centralized water supply network to the end user, the quality of drinking water can vary from the condition of pipes and various stages of purification16. The use of geographic information system (GIS) tools allows you to store, process and have access to water supply network data. The possibility of engineering calculations is the main reason for the decision to implement geoinformation systems. Currently, there are many ready-made geoinformation systems for monitoring water supply, which are used in different countries. The most widespread and popular software for cartography and spatial analytics worldwide is considered to be ArcGIS, ESRI17. ESRI projects in GIS solutions for water systems in the world account for about 80 %. This system, for example, is used by scientists to assess and control water quality in the distribution system of the city of Denizli, Turkey18. There are also local geoinformation technologies that can better take into account the specifics of organizations providing water supply, regulatory requirements, flexibly and quickly adapt to customer requirements. In most cases, the maintenance of centralized water supply systems in cities is carried out by state-owned municipal enterprises, for which priority may be given to domestic software. For example, in India, the local GIS “IGiS” is used19, in Spain, Xylem Vue based on GoAigua (Irdrica company) is used for water resources management, including the management of drinking water supply networks20, customers from Peru, Colombia, the USA, etc. also use the products of this company. In Russia, the ZuluGIS geoinformation system with the ability to calculate engineering communications is widely used by organizations of the energy complex and water supply21. The main advantages of the program are the possibilities of network inventory and hydraulic calculation of pressure and flow for connecting new buildings and structures. The program also allows you to check pipes for compliance and speed up the replacement of damaged sections of networks.
The purpose of the scientific research is to consider and apply tools for obtaining and processing heterogeneous data, and integrating the obtained data with GIS systems. To do this, it is necessary to solve the following tasks: determining the mechanism and means of transmitting data from key measuring points of the water supply network, systematization of heterogeneous data, development of an approach to integrated assessment of water quality, visual representation to monitoring services of the current situation on a map in real time. To perform the tasks set, the method of modeling real sections of the centralized water supply network using a network layout with real sensors installed on it is used. The data obtained characterize the condition of the water supply network.
Materials and Methods
Centralized water supply networks have different physical, operational and environmental characteristics. Physical characteristics are the characteristics of the circuit and the condition of the network, such as the material, diameter or age of the pipes. Operational factors include network-related parameters such as water properties, pressure, or speed. Environmental factors include external conditions that affect network performance, such as climate, soil erosion, land use, etc.
Laboratory and production control are used to assess water quality. It is performed in places of water intake from wells, at purification points, at the nodal points of the centralized water supply network and includes a set of measures to assess the organoleptic, chemical and biological properties of water. The number of basic control points depends on the length of the network and the number of water users.
To control the quality of pipes by the chemical composition of water, the developed monitoring system uses AQ-EC3-EL3 electrical conductivity sensors from Aqua-lab, measuring electrical conductivity in the range from 0.1-20 mSm/cm, the analog output takes values of 4-20 mA. The sensors are located at the control points of the centralized water supply system22. In order to promptly detect the resulting water losses, it is necessary to monitor changes in the volume of water supply to the local area, as well as piezometric levels in the network. For this purpose, electromagnetic flowmeters from IFM Electronic SM6100 are used with an analogy current output of 4-20 mA.
After determining the basic control points in the centralized water supply system, it is necessary to localize the problem areas. They can be identified by a sharp increase in mineralization associated with corrosion of pipes, as well as by data on the flow rate and pressure of water in the distribution network. To do this, according to the data obtained, wear or leakage can be localized at the basic control points using a hydrodynamic model23.
In the methodology for assessing the quality of drinking water supplied by centralized drinking water supply systems, the main criterion is the compliance of harmful substances with the maximum permissible concentration (MPC)24. The collected data at key points are analyzed by the staff of sanitary and epidemiological supervision and the services of the water distribution network and compared with the established MPC standards.
However, according to such an assessment, it is impossible to say unequivocally whether the water is of high quality in general, this method is more suitable for studying specific indicators. In order to optimize the methods for the task of integral assessment of water quality, a parametric model of the technical condition of centralized water supply was applied25. In this model, the following indicators are grouped and distinguished: chemical, biological, electrical conductivity, hydrodynamic. Thus, an estimate is formed by groups of indicators, but simplifications will affect the accuracy. It is also proposed to collect heterogeneous data remotely via the Internet and GPRS channels. After taking measurements at the control points, a set of values is obtained that need to be compared and evaluated for each parameter separately. This method of assessment allows you to get the most complete picture of the state of the centralized water supply network.
According to the developed structure of information monitoring of the centralized water supply system31, data on chemical composition, electrical conductivity, biological and hydrodynamic parameters are transmitted to the OwenCloud cloud service. Data systematization, analysis and presentation of results are carried out in the Zulu GIS GIS.
The initial data for analyzing the condition of pipes are the results of monitoring from key observation points, presented in the form of a GIS database table. Table 1 shows the fields characterizing the control result. Table 2 shows the fields for normalization of results according to hygienic standards32.
Table 1. Fields of table elements with control results
NO. |
FIELD NAME |
TYPE |
DESCRIPTION |
1. |
ID |
Short int |
|
2. |
Post |
String |
Post code |
3. |
Date |
Date |
Date of measurement |
4. |
Conductivity |
Float |
Hardness, mineralization, temperature |
5. |
Chemicalindicator |
Float |
Iron |
6. |
Biologicalindicator |
Float |
Ironbacteria |
7. |
Hydrodynamicindicator |
Float |
Indications of flowmeters and pressure gauges |
Source: Own elaboration.
Table 2. Fields of elements of the table of hygienic standards
NO. |
FIELD NAME |
TYPE |
1. |
ID |
Short int |
2. |
Parameter name |
String |
3. |
Units of measurement |
String |
4. |
Normative indicators |
Float |
5. |
Accuracy of the method |
Float |
6. |
IndicatorGroup |
String |
Source: Own elaboration.
Two tables with control results and data of hygienic standards are submitted to the input. The cycle is started on the selected date, then the cycle is started on the indicators until all control results for the selected date have been enumerated. If the value of the control result is greater than or equal to zero (there was a measurement of this indicator), then the indicator class is checked. After determining the class, the indicator value is analysed in accordance with the methodology, and the resulting score is entered in the results table (Table 3).
Table 3. Fields of the results table
NO. |
FIELD NAME |
TYPE |
1. |
ID |
Short int |
2. |
Post |
String |
3. |
Date of measurement |
Date |
4. |
Conductivity |
Float |
5. |
Chemicalindicator |
Float |
6. |
Biologicalindicator |
Float |
7. |
Hydrodynamicindicator |
Float |
Source: Own elaboration.
The value for each indicator can have “-1” - deviation from the standard, “1” —the indicator is normal and “0”— the indicator was not measured (lack of a measuring sensor or a technical reason). The resulting table is imported into the ZuluGISgeodata database for further display of the analysis results on the map.
Results
To detect the breakthrough point based on the data of mineralization of hydrodynamic pressure and water flow at control points, a computer simulation of a section of the water supply network was carried out. A pipe with a diameter of 160 millimeters and a length of 1000 meters was selected. The initial and final parameters were set at the control points of the beginning and end of the pipe (Figure 1).
Figure 1. The graph for determining the breakout point
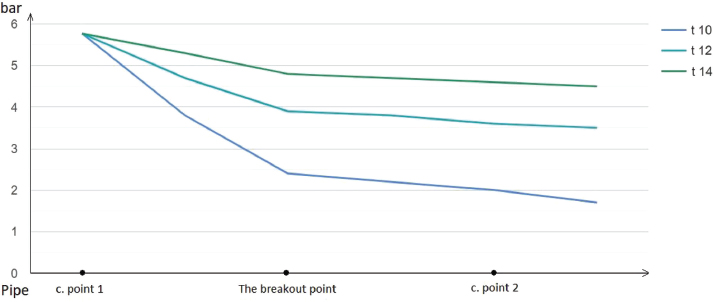
Source: Own elaboration.
As a result, the expected point of pipe rupture associated with corrosion was determined. The calculations were carried out taking into account the user’s water intake at different hours of the day (t 10, t 12 t 14).
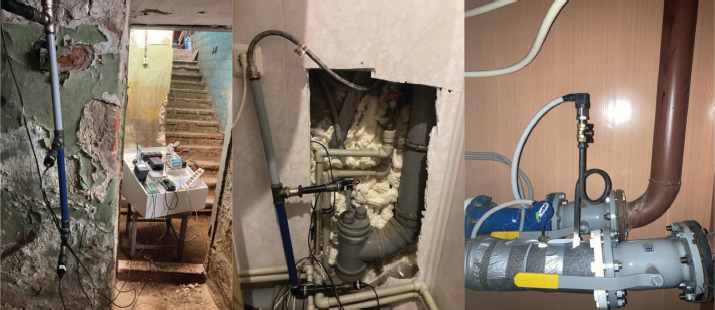
Then, full-scale measurements were carried out on a model of a section of the water supply network (Figure 2). The sensors were installed on branches from the main highway in basements and utility rooms of buildings.
Figure 2. Measurements on a section of the water supply network
Source: Own elaboration.
The sensors were interrogated using a programmable logic controller “OWEN PLC 150”. The data was then sent via the Modbus TCP protocol to the computer. In the RAD programming environment, a program was written in Delphi that polls the controller every 100 ms. as a result, the data is displayed in real time. To link data to a terrain map, the developed program used the ZuluXTools library for programmatic access to Zulu data. ZuluXTools uses the ZuluGIS core to work with graphical and semantic data, so the map embedded in the form of the created application looks identical to how it is prepared in the ZuluGIS shell itself, including layer settings, semantic data labels and thematic coloring (Figure 3).
Figure 3. Data collection program from the controller (Composed by the author)
Source: Own elaboration.
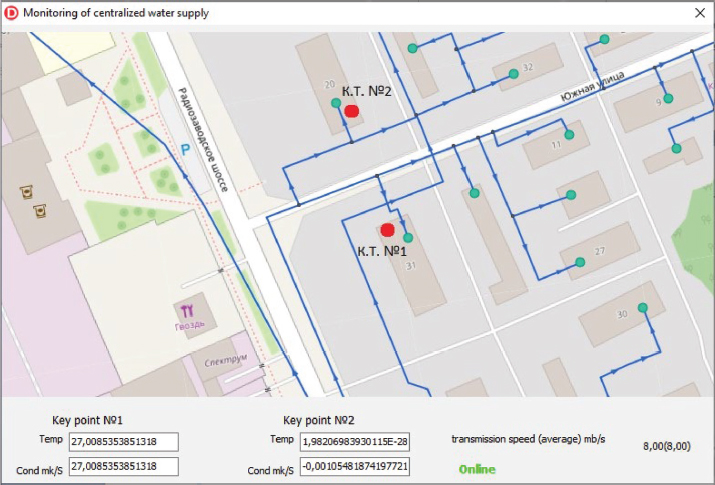
The data was collected and processed in the software developed by the author. To link the data to the terrain map, real measurements were taken at control posts on the network sections. The information is linked to a specific section of the centralized water supply network and displayed in the geographic information system Zulu GIS (Figure 4).
Figure 4. The result of monitoring at key points
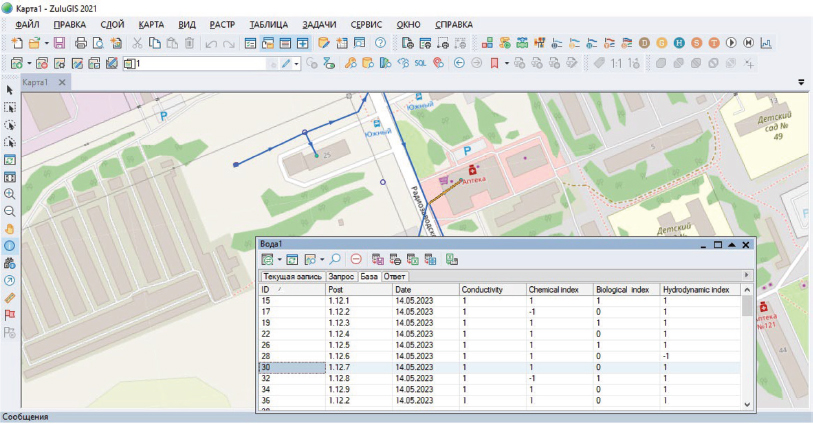
Source: Own elaboration.
The data is displayed on the map in the ZuluGIS app. A feature of ZuluGIS is that the schemes of engineering networks are created with the support of their topology, which allows the use of built-in modules for performing hydraulic calculations, constructing piezometric graphs and longitudinal profiles. You can select a section of the pipeline (highlighted in yellow in the figure) and get information on this section of the network. For example, at post 1.12.7, the conductivity, chemical and hydrodynamic indicators are normal, the biological indicator was not measured on this section of the network. and at the post 1.12.6, the hydrodynamic indicator has a deviation from the norm, which may indicate deposits in the pipe and possible wear. Then management decisions are made by the water utility service.
Discussion
The assessment of water quality in the centralized water supply network is determined by a regulatory document26. In this paper, the author has optimized this method for the task of integral assessment of water quality. Based on the previously obtained results27, a parametric model of the technical condition of centralized water supply was applied to the formation of an assessment based on groups of indicators taken from control points. The presented work shows the results of modeling the breakthrough sites based on the data of mineralization of hydrodynamic pressure and water flow at two control points. As a result, the expected point of pipe rupture associated with corrosion was determined (Table 4). The control points c.point 1 and c.point 2 at a distance of 1000 meters are optimal for this model so far. This model can be used for water supply networks. In this case, to select the minimum number of control points, the standards should be followed28.
Table 4. Minimum number of required control points for calibration of hydraulic models
NETWORK LENGTH, KM |
NUMBER OF NETWORK PRESSURE MEASUREMENT POINTS |
Less than 100 |
20-30 |
100-200 |
30-50 |
200-400 |
50-70 |
400-800 |
70-100 |
After taking measurements, a set of values is obtained that need to be compared and evaluated for each parameter separately. Currently, laboratory and production control are used to assess water quality, which is performed by personnel at the sites of water intake from wells, at the nodal points of the centralized water supply network23. In the presented work, an approach is proposed and implemented, which consists in automated data collection from key points, as well as automated analysis and comparison of the obtained data with normative ones. As a result, a table with an estimate for each indicator is formed and linked to a specific section of the centralized water supply network.
The developed analytical software for monitoring centralized water supply was tested in Murom, Vladimir region of the Russian Federation, together with the municipal service organization Municipal Unitary Enterprise Vodokanal. Figure 5 shows an accident associated with a burst worn pipe.
Figure 5. Pipe break in a section of the water supply network, Murom
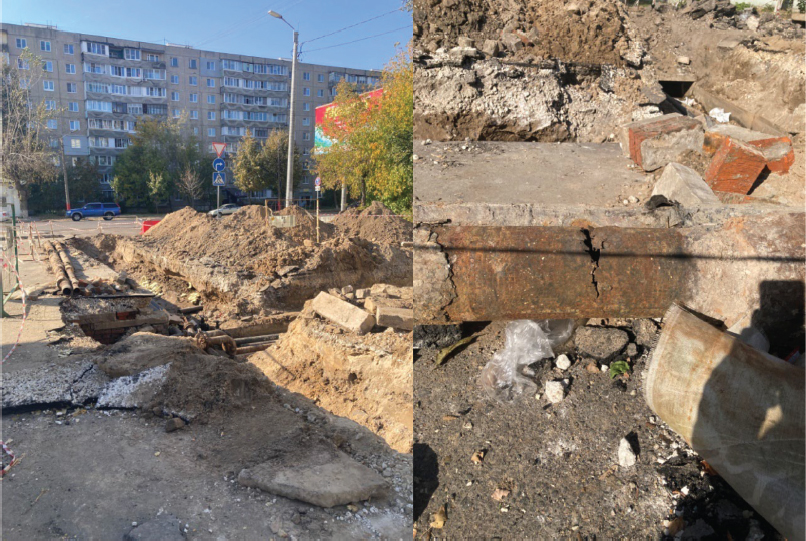
Source: Own elaboration.
Monitoring of the potentially emergency site was carried out during June-August 2023. Consultations were held with the chief engineer and employees of the Municipal Unitary Enterprise Vodokanal.
In September 2023, it was decided to excavate the site. As a result, a leak was detected in the pipe with an accuracy of 4 meters and a probability of γ=0.9. For the experiment, this is a good result. However, in order to obtain such accuracy from the developed system, it is necessary to involve specialists from vodokanal organizations and rely on their expert opinion. To fully implement the developed system in organizations serving water supply networks, it is also necessary to collect statistics on breakthroughs in sections of the water supply network, determine their geolocation more accurately, and calibrate the developed model for detecting water leaks. It is also necessary to test and debug the developed software in various critical conditions, to increase the trust of users and customers in the developed product. Nevertheless, the tasks related to the use of geoinformation technologies that were set in this article have been achieved.
Conclusion
Thus, in this article, an approach was proposed to process heterogeneous data on the state of centralized water supply obtained from key measuring points. The existing methods and approaches to assessing the quality of drinking water of centralized water supply are considered. Based on the methodology for assessing the improvement of drinking water quality developed by Rospotrebnadzor, the author’s approach to assessing the quality of the state of the water supply network according to a group of indicators (chemical, biological, hydrodynamic) was compiled and adapted. The analysis is carried out for each section of the network between key points.
Full-scale measurements were carried out on a model of a section of the water supply network. The data was collected and processed in the software developed by the author. To link the data to the terrain map, real measurements were taken at control posts on the network sections. The information is linked to a specific section of the centralized water supply network and displayed in the geographic information system ZuluGIS. The limitations of the proposed method at this stage of research are not fully debugged software developed by the author, not collected statistics on the detection of leaks of various origins within the whole city.
The prospect of this study will be the collection and analysis of data from control points of the network of an entire city and the integration of the developed system into the housing and communal services sector and into the work of enterprises engaged in the extraction and supply of water to users, in order to reduce the risks of accidents and deterioration of water quality in a centralized water supply system.
Funding
This work was supported by a grant from the President of the Russian Federation MK-1800.2022.1.6.
Bibliography
Alves, Maria Tereza Ribeiro; Teresa, Fabricio Barreto; Nabout, João Carlos. 2014: A global scientific literature of research on water quality indices: trends, biases and future directions”. Acta Limnologica Brasiliensia, 26(3), 245-253. https://doi.org/10.1590/S2179-975X2014000300004
Antsiferov, Sergey; Usmanova, Elena. 2015: Analysis of the effect of internal corrosion on pipeline operation. Bulletin of the NSUEE. 6(49), 5-10. https://www.elibrary.ru/download/elibrary_23823491_44937569.pdf
ArcGIS. 2024: Urban Planning and Development. ArcGIS https://www.esri.com/en-us/about/about-esri/technology
Bernabé-Crespo, Miguel Borja. 2022: Implicaciones y perspectivas del mix hídrico para el abastecimiento de agua potable en el sureste de España. Agua y Territorio / Water and Landscape, 20, 5-21. https://doi.org/10.17561/at.20.5714
Bernabé-Crespo, Miguel Borja; Loáiciga, Hugo. 2019: El suministro hídrico a la aglomeración urbana de Los Ángeles, California (EEUU). Agua y Territorio / Water and Landscape, 13, 35-42. https://doi.org/10.17561/at.13.3789
Bernabé-Crespo, Miguel Borja; Olcina Cantos, Jorge; Lahora Agustín. 2022: Examining the implementation of potable water reuse in sewersheds of Southeastern Spain. Urban Water Journal, 19(6), 629-640. https://doi.org/10.1080/1573062X.2022.2069043
Cen, Hang; Huang, Delong; Liu, Qiang; Zong, Zhongling; Tang, Aiping. 2023: Application Research on Risk Assessment of Municipal Pipeline Network Based on Random Forest Machine Learning Algorithm. Water, 15(10), 1964. https://doi.org/10.3390/w15101964
Ercin, Artug; Hoekstra, Arjen. 2014: Water footprint scenarios for 2050: A global analysis. Environment International. 64, 71-82. https://doi.org/10.1016/j.envint.2013.11.019
Federal Service for Supervision of Consumer Rights Protection and Human Well-being. 2020: Methodology for assessing the improvement of the quality of drinking water supplied by centralized drinking water supply systems, Methodological recommendations MP 2.1.4.0143-19. Legalacts https://legalacts.ru/doc/mr-2140143-19-214-pitevaja-voda-i-vodosnabzhenie-naselennykh-mest/
González Trujillo, Mayelin; García Tejera, Rogelio; Duran Silveira, María Teresa; Grau Cádiz, Celia Rosa. 2022. The impact of land use on the vulnerability of an aquifer in the San Juan watershed, Cuba. Agua y Territorio / Water and Landscape, 21, 21-35. https://doi.org/10.17561/at.21.6263
Gromov, Grigory; Khudyakova, Darya; Pyankov, Kirill. 2021: “Approaches to the implementation of hydraulic electronic models of centralized water supply systems”. Bulletin of MGSU, 16(5), 623-634. https://doi.org/10.22227/1997-0935.2021.5.623-634
Idrica. 2024: Smart solutions to optimise end-to-end management of drinking water supply plants and networks. Idrica. https://www.idrica.com/platform/water/
Koc, Cem; Fehiman, Çiner; Selcuk, Toprak; Huseyin, Selcuk. 2010: The Geographical Information System (GIS) based water quality assessment of a drinking water distribution system in the Denizli City. Desalination and Water Treatment 19, 1, 318-324. https://doi.org/10.5004/dwt.2010.1940
Koppel, Tiit; Vassiljev, Anatoli. 2009: Calibration of a model of an operational water distribution system containing pipes of different age. Advances in Engineering Software, 40, 659-664. https://doi.org/10.1016/j.advengsoft.2008.11.015
Kupriyanovsky, Vasily; Schichko, Anton; Namiot, Dimitry; Kupriyanovsky, Julia. 2016: "Reasonable Water": Integrated Water Resources Management on the basis of smart technologies and models for smart cities. International Journal of Open Information Technologies, 4(4), 20-29. http://injoit.org/index.php/j1/article/view/279/231
Kurakina, Natalia; Belkin, Ivan. 2022: Technologies of information support for quality control of drinking water supply using GIS. Izvestiya SPEU, 2, 23-31. https://doi.org/10.32603/2071-8985-2022-15-2-23-31
Larrinaga Rodríguez, Carlos. 2024: El abastecimiento de agua en una ciudad industrial: Bilbao (España), 1877-1936. Agua y Territorio / Water and Landscape, 24, 255-267. https://doi.org/10.17561/at.24.8066
Mekonnen, Masfin; Hoekstra, Arjen. 2016: Four billion people facing severe water scarcity. Science Advances, 2, e1500323. https://www.science.org/doi/10.1126/sciadv.1500323
Mohammed, Eliyas; Zeleke, Ethiopia; Abebe, Surafel. 2021: Water leakage detection and localization using hydraulic modeling and classification. Journal of Hydroinformatics, 23(4) 782-794. https://doi.org/10.2166/hydro.2021.164
Navarro-Díaz, Adrián; Delgado-Aguiñaga, Jorge-Alejandro; Begovich, Ofelia; Besançon, Gildas. 2021: Two Simultaneous Leak Diagnosis in Pipelines Based on Input-Output Numerical Differentiation. Sensors, 21, 8035. https://doi.org/10.3390/s21238035
Page, Philip; Zulu, S’bonelo; Mothetha, Matome. 2019: Remote real-time pressure control via a variable speed pump in a specific water distribution system. Journal of Water Supply: Research and Technology-Aqua, 68, 20-28. https://doi.org/10.2166/aqua.2018.074
Pineda-Pablos, Nicolás.; Salazar-Adams, Alejandro. 2016: Cities and drought in Mexico. Water management as a mitigation critical strategy. Tecnología y Ciencias del Agua, 7, 95-113. https://www.cabdirect.org/cabdirect/abstract/20183068452
Romanov, Roman; Kochetkova, Sofia. 2022: Development of a parametric model of the technical condition of centralized water supply. Proceedings of Tula State University. Technical sciences. 10, 137-140.https://www.elibrary.ru/download/elibrary_54960546_80621163.pdf
Romanov, Roman; Kochetkova, Sofia. 2023: Information model of the centralized water supply monitoring system using GIS, in Proceedings of SPIE 12564, 2nd International Conference on Computer Applications for Management and Sustainable Development of Production and Industry (CMSD-II-2022), 125640M. https://doi.org/10.1117/12.2669229
Rosaneli, Caroline; Fischer, Marta Luciane; Sganzerla, Anor; Neto, Alberto Paulo. 2021: Interação água e saúde global: uma questão bioética. Agua y Territorio / Water and Landscape, 19, 111-124. https://doi.org/10.17561/at.19.5471
Santos-Ruíz, Ildeberto de los; Bermúdez, José Roberto; López-Estrada, Francisco Ronay; Puig, Vicenç; Torres, Lizeth; Delgado-Aguiñaga, Jorge Alejandro. 2018: Online leak diagnosis in pipelines using an EKF-based and steady-state mixed approach. Control Systems Engineering, 81, 55-64. https://doi.org/10.1016/j.conengprac.2018.09.006
Scanpoint geomatics limited (SGL). 2024: Role of Geo-Spatial Technology (GIS) in Water Resource Management https://www.sgligis.com/gis-for-water-resource/
Shojaie, Elham; Darihaki, Farzin; Shirazi, Siamack. 2023: A method to determine the uncertainties of solid particle erosion measurements utilizing machine learning techniques. Wear, 522, 204688. https://doi.org/10.1016/j.wear.2023.204688
State Report of the Russian Federation. 2021: On the state of sanitary and epidemiological welfare of the population in the Russian Federation in 2020. 256. https://www.rospotrebnadzor.ru/upload/iblock/5fa/gd-seb_02.06-_s-podpisyu_.pdf
Syromyatnikov, Denis; Pyatkina, Darya; Kondratenko, Larisa; Krivolapov, Sergey; Stepanova, Diana. 2019: Big data analysis for studying water supply and sanitation coverage in cities (Russia). Espacios, 40(27), 14. https://www.revistaespacios.com/a19v40n27/19402721.html
United Nations, Department of Economic and Social Affairs, Population Division. ST/ESA/SER.A/420. 2019: Prospects for global urbanization. United Nations, New York (USA) http://www.megacities.uni-koeln.de/documentation/megacity/statistic/wup2003.pdf
United Nations, General Assembly Resolution A/RES/76/153. 16 December 2021. 2021: Human rights to safe drinking water and sanitation United Nations, New York (USA) https://documents.un.org/doc/undoc/gen/n21/402/23/pdf/n2140223.pdf
Zahedi, Peyman; Parvandeh, Saeid; Asgharpour, Alireza; McLaury, Brenton; Shirazi, Siamack; McKinney, Brett. 2018: Random forest regression prediction of solid particle Erosion in elbows. Powder Technology, 338, 983-992. https://doi.org/10.1016/j.powtec.2018.07.055
Zhou, Xiao; Tang, Zhenheng; Xu, Weirong; Meng, Fanlin; Chu, Xiaowen; Xin, Kunlun; Fu, Guangtao. 2019: Deep learning identifies accurate burst locations in water distribution networks. Water Research, 166, 115058. https://doi.org/10.1016/j.watres.2019.115058
ZuluGIS. 2024: ZuluGIS is a system for creating maps, modeling engineering networks and developing GIS applications https://www.politerm.com/products/geo/zulugis/
_______________________________
1 Bernabé-Crespo, 2022. Bernabé-Crespo; Olcina Cantos; Lahora 2022. Larrinaga Rodríguez, 2024.
2 United Nations, General Assembly Resolution, 2021.
4 Ercin; Hoekstra, 2014. Bernabé-Crespo; Loáiciga, 2019.
5 United Nations, Department of Economic and Social Affairs, 2019.
7 Santos-Ruíz et al., 2018. Navarro-Díaz et al., 2021.
8 State Report of the Russian Federation, 2021.
9 Alves; Teresa; Nabout, 2014. Rosaneli et al., 2021.
10 Pineda-Pablos; Salazar-Adams, 2016.
12 Zahedi et al., 2018. Shojaie; Darihaki; Shirazi, 2023.
13 Kupriyanovsky et al., 2016. Page; Zulu; Mothetha, 2019.
15 González et al., 2022. Kurakina; Belkin, 2022.
16 Antsiferov; Usmanova, 2015.
19 Scanpoint geomatics limited (SGL), 2024.
23 Mohammed; Zeleke; Abebe, 2021.
24 Federal Service for Supervision of Consumer Rights Protection and Human Well-being, 2020.
27 Federal Service for Supervision of Consumer Rights Protection and Human Well-being, 2020.
28 Koppel; Vassiljev, 2009. Gromov; Khudyakova; Pyankov, 2021.